| __timestamp | Booz Allen Hamilton Holding Corporation | Trane Technologies plc |
|---|---|---|
| Wednesday, January 1, 2014 | 2762580000 | 3908600000 |
| Thursday, January 1, 2015 | 2680921000 | 3999100000 |
| Friday, January 1, 2016 | 2825712000 | 4179600000 |
| Sunday, January 1, 2017 | 3112302000 | 4386000000 |
| Monday, January 1, 2018 | 3304750000 | 4820600000 |
| Tuesday, January 1, 2019 | 3603571000 | 5147400000 |
| Wednesday, January 1, 2020 | 4084661000 | 3803400000 |
| Friday, January 1, 2021 | 4201408000 | 4469600000 |
| Saturday, January 1, 2022 | 4464078000 | 4964800000 |
| Sunday, January 1, 2023 | 4954101000 | 5857200000 |
| Monday, January 1, 2024 | 2459049000 | 7080500000 |
Unveiling the hidden dimensions of data
In the ever-evolving landscape of corporate finance, understanding gross profit trends is crucial for investors and analysts alike. This analysis delves into the financial trajectories of Trane Technologies plc and Booz Allen Hamilton Holding Corporation from 2014 to 2023. Over this period, Trane Technologies consistently outperformed Booz Allen Hamilton in terms of gross profit, with a notable peak in 2023, where it achieved a 50% higher gross profit than Booz Allen Hamilton.
Booz Allen Hamilton, while showing steady growth, experienced a significant dip in 2024, highlighting potential challenges or strategic shifts. Trane Technologies, on the other hand, demonstrated resilience and growth, with a 50% increase in gross profit from 2014 to 2023. This data underscores the importance of strategic financial planning and market adaptability in maintaining competitive advantage.
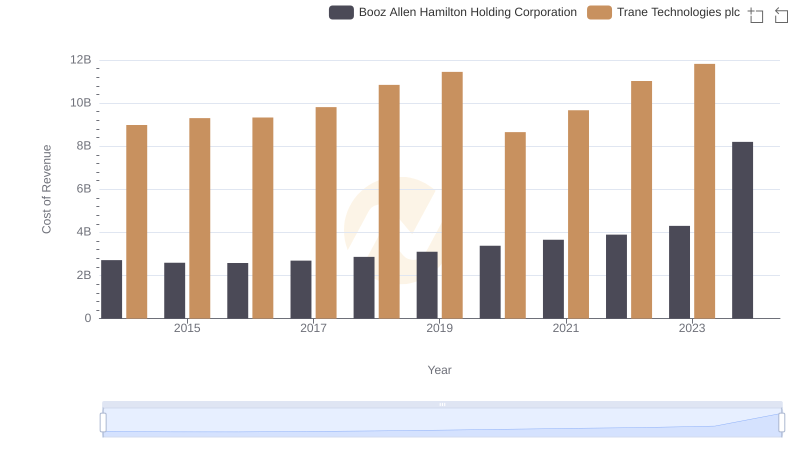
Cost of Revenue Trends: Trane Technologies plc vs Booz Allen Hamilton Holding Corporation
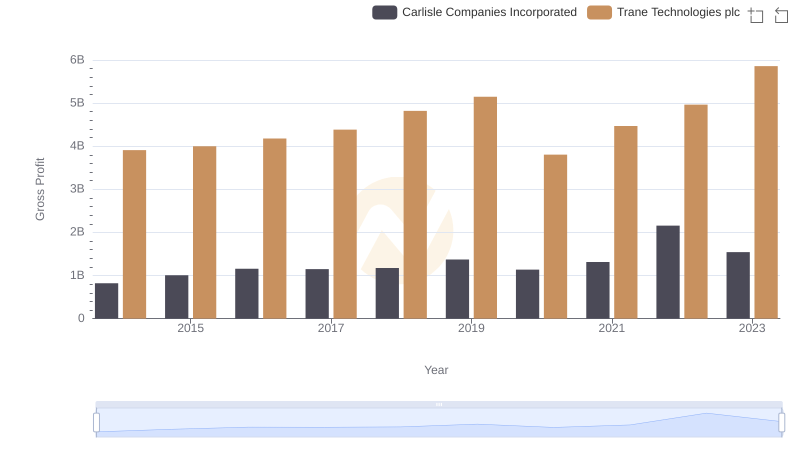
Key Insights on Gross Profit: Trane Technologies plc vs Carlisle Companies Incorporated
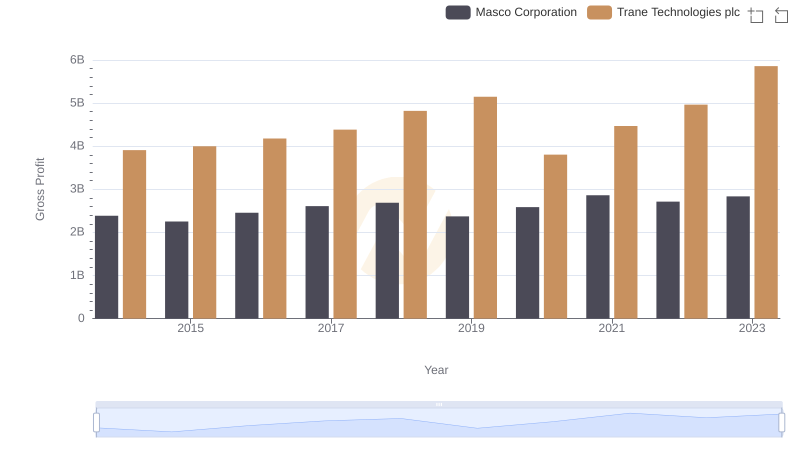
Trane Technologies plc vs Masco Corporation: A Gross Profit Performance Breakdown
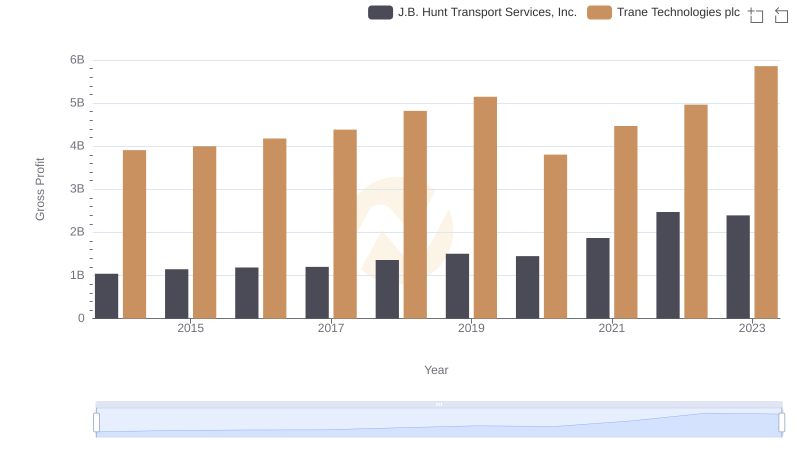
Gross Profit Comparison: Trane Technologies plc and J.B. Hunt Transport Services, Inc. Trends
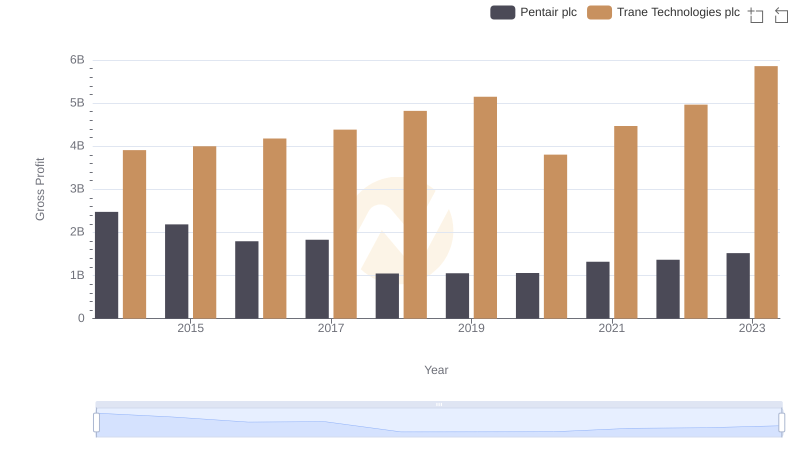
Trane Technologies plc and Pentair plc: A Detailed Gross Profit Analysis
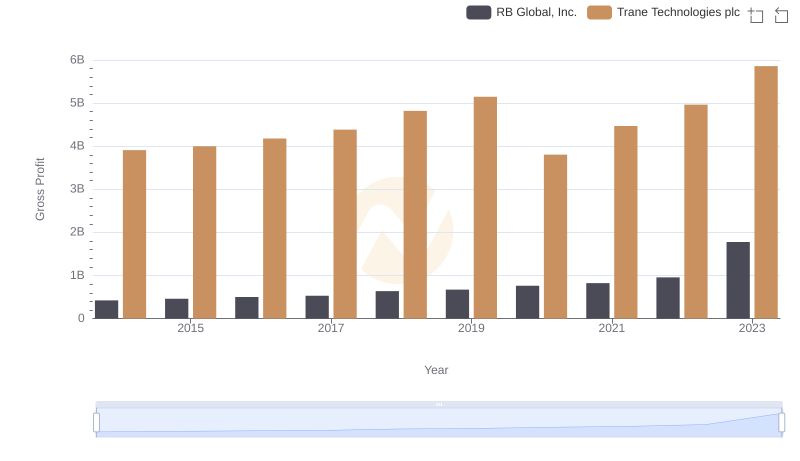
Who Generates Higher Gross Profit? Trane Technologies plc or RB Global, Inc.
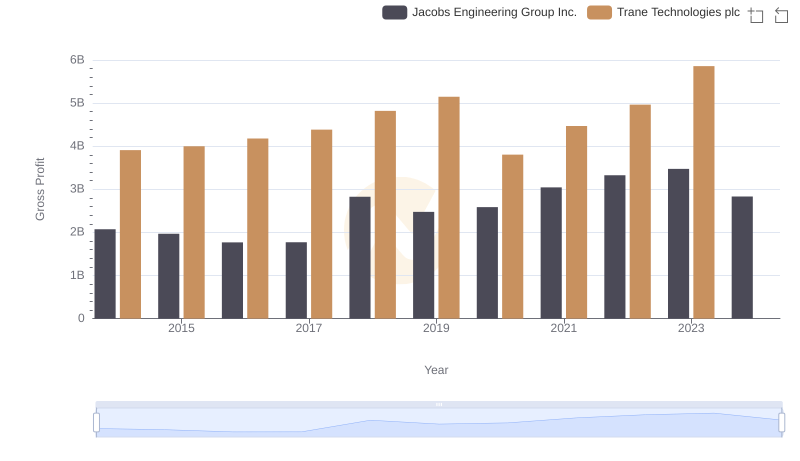
Who Generates Higher Gross Profit? Trane Technologies plc or Jacobs Engineering Group Inc.
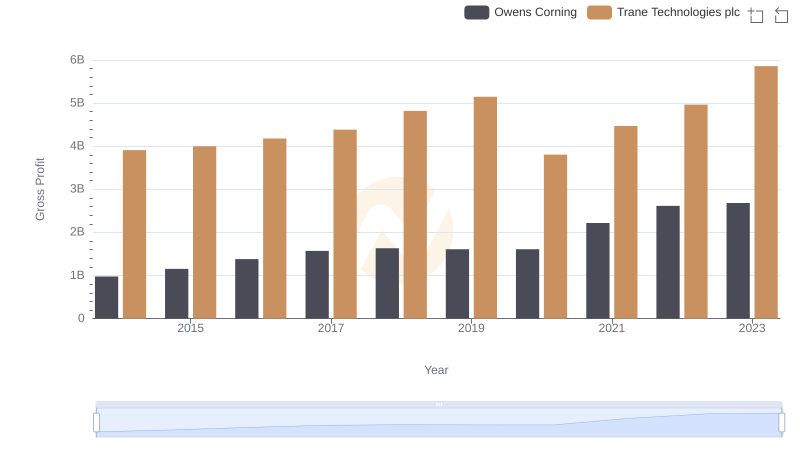
Gross Profit Analysis: Comparing Trane Technologies plc and Owens Corning
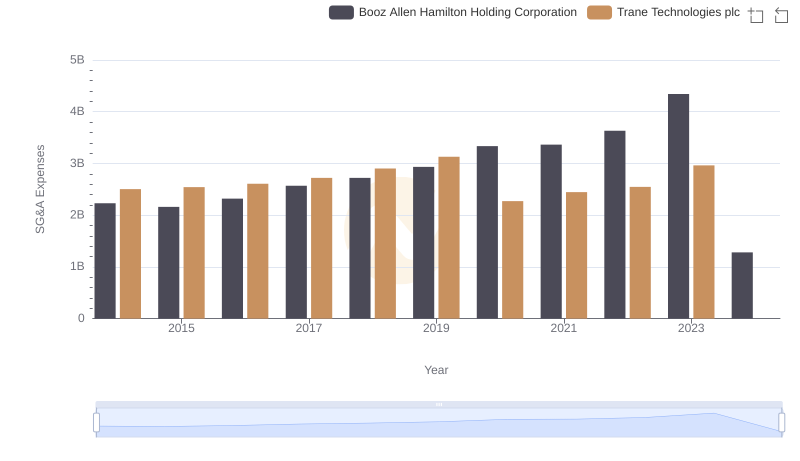
Trane Technologies plc and Booz Allen Hamilton Holding Corporation: SG&A Spending Patterns Compared

Professional EBITDA Benchmarking: Trane Technologies plc vs Booz Allen Hamilton Holding Corporation