| __timestamp | Builders FirstSource, Inc. | Parker-Hannifin Corporation |
|---|---|---|
| Wednesday, January 1, 2014 | 1247099000 | 10188227000 |
| Thursday, January 1, 2015 | 2662967000 | 9655245000 |
| Friday, January 1, 2016 | 4770536000 | 8823384000 |
| Sunday, January 1, 2017 | 5306818000 | 9188962000 |
| Monday, January 1, 2018 | 5801831000 | 10762841000 |
| Tuesday, January 1, 2019 | 5303602000 | 10703484000 |
| Wednesday, January 1, 2020 | 6336290000 | 10286518000 |
| Friday, January 1, 2021 | 14042900000 | 10449680000 |
| Saturday, January 1, 2022 | 14982039000 | 11387267000 |
| Sunday, January 1, 2023 | 11084996000 | 12635892000 |
| Monday, January 1, 2024 | 12801816000 |
Unveiling the hidden dimensions of data
In the ever-evolving landscape of industrial and construction sectors, Parker-Hannifin Corporation and Builders FirstSource, Inc. stand as titans. Over the past decade, these companies have showcased intriguing trends in their cost of revenue, a critical metric reflecting the direct costs attributable to the production of goods sold.
From 2014 to 2023, Parker-Hannifin's cost of revenue has seen a steady increase, peaking at approximately $12.6 billion in 2023. This represents a growth of around 24% from its 2014 figures, highlighting the company's expanding operations and market reach.
Builders FirstSource, on the other hand, experienced a dramatic surge, with its cost of revenue skyrocketing by over 800% from 2014 to 2022, before slightly declining in 2023. This reflects the company's aggressive expansion and adaptation to market demands.
The data for 2024 is incomplete, leaving room for speculation on future trends.
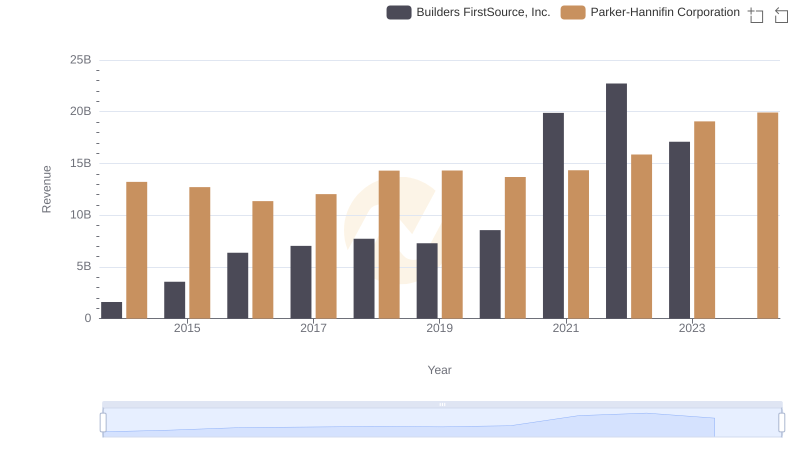
Annual Revenue Comparison: Parker-Hannifin Corporation vs Builders FirstSource, Inc.
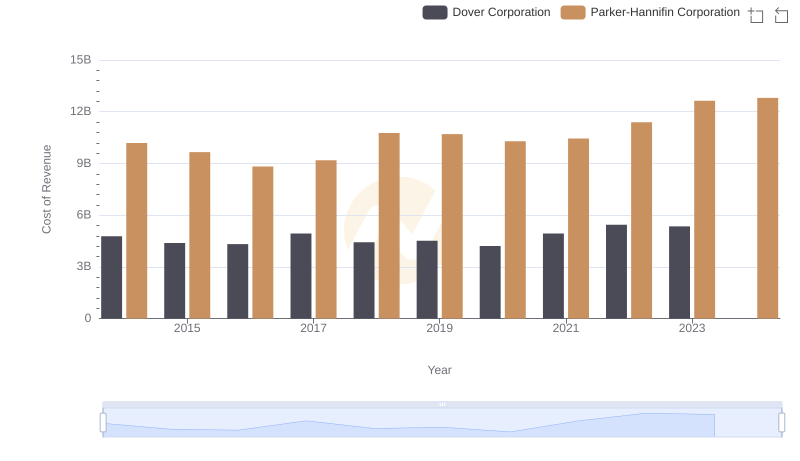
Cost Insights: Breaking Down Parker-Hannifin Corporation and Dover Corporation's Expenses
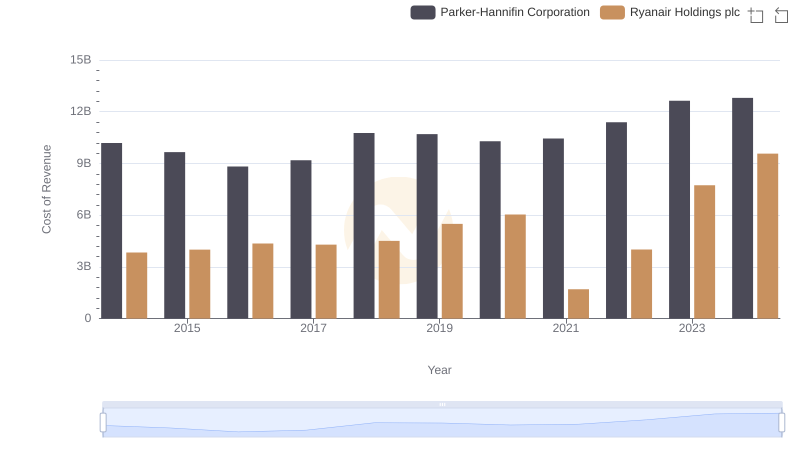
Cost Insights: Breaking Down Parker-Hannifin Corporation and Ryanair Holdings plc's Expenses
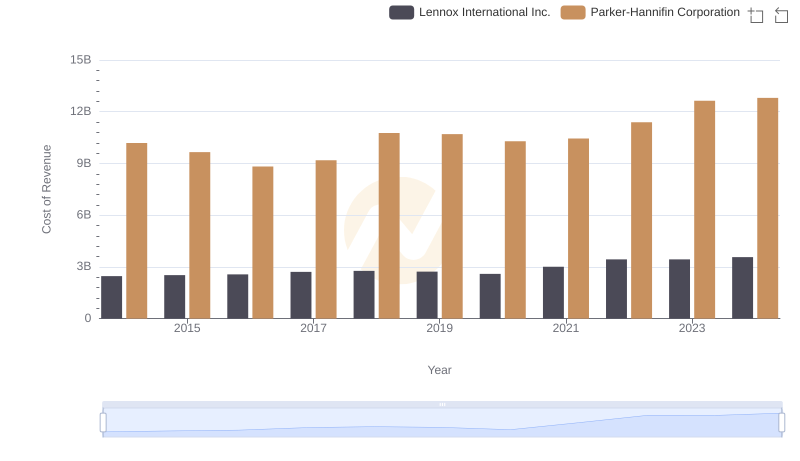
Analyzing Cost of Revenue: Parker-Hannifin Corporation and Lennox International Inc.
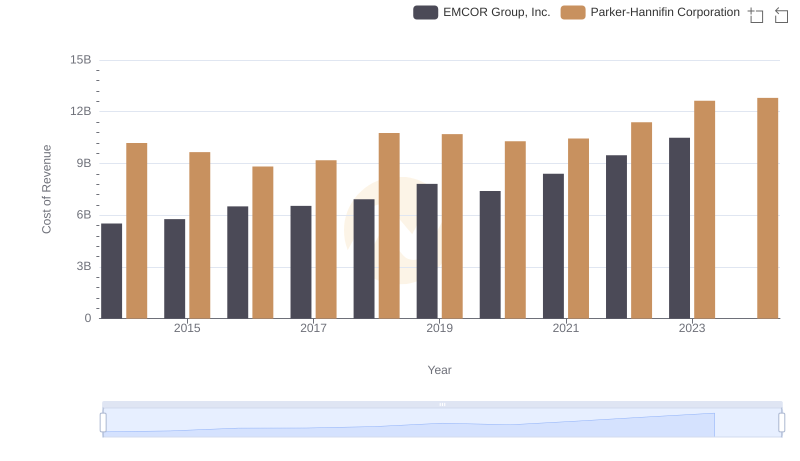
Cost Insights: Breaking Down Parker-Hannifin Corporation and EMCOR Group, Inc.'s Expenses
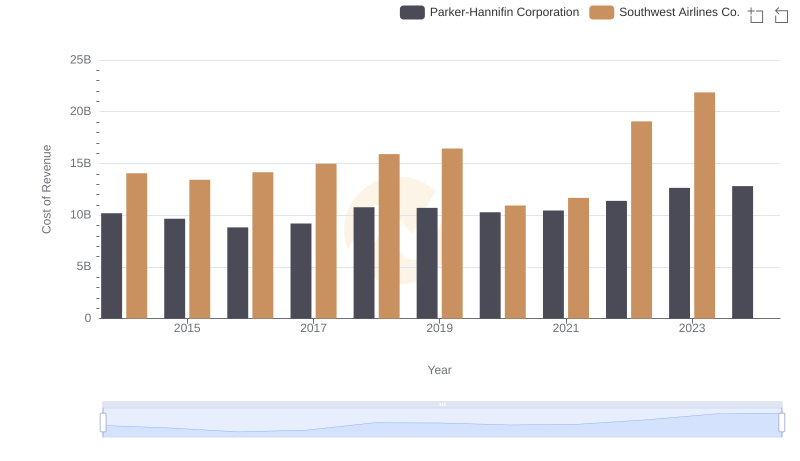
Comparing Cost of Revenue Efficiency: Parker-Hannifin Corporation vs Southwest Airlines Co.

Cost of Revenue Comparison: Parker-Hannifin Corporation vs TransUnion
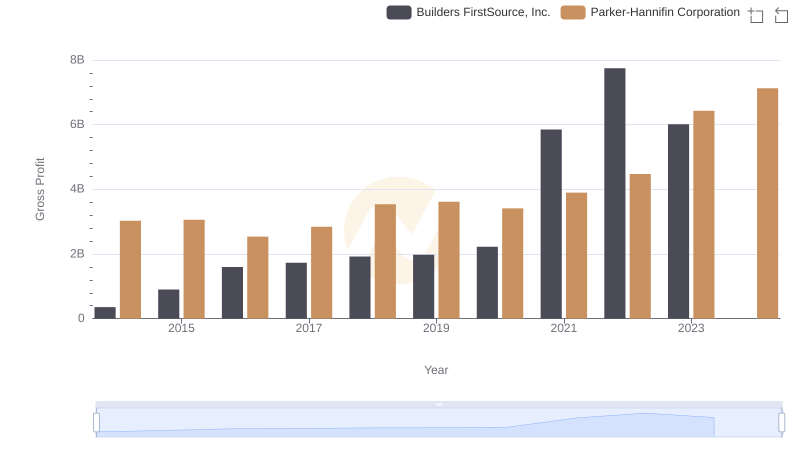
Parker-Hannifin Corporation and Builders FirstSource, Inc.: A Detailed Gross Profit Analysis
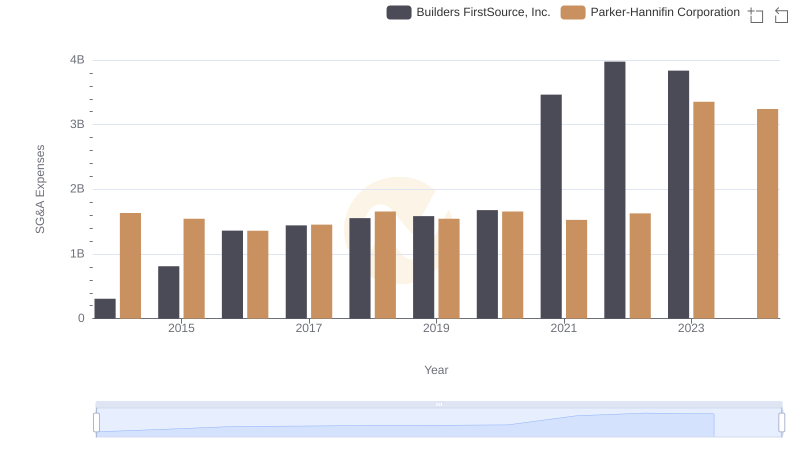
Comparing SG&A Expenses: Parker-Hannifin Corporation vs Builders FirstSource, Inc. Trends and Insights