| __timestamp | Lennox International Inc. | Parker-Hannifin Corporation |
|---|---|---|
| Wednesday, January 1, 2014 | 2464100000 | 10188227000 |
| Thursday, January 1, 2015 | 2520000000 | 9655245000 |
| Friday, January 1, 2016 | 2565100000 | 8823384000 |
| Sunday, January 1, 2017 | 2714400000 | 9188962000 |
| Monday, January 1, 2018 | 2772700000 | 10762841000 |
| Tuesday, January 1, 2019 | 2727400000 | 10703484000 |
| Wednesday, January 1, 2020 | 2594000000 | 10286518000 |
| Friday, January 1, 2021 | 3005700000 | 10449680000 |
| Saturday, January 1, 2022 | 3433700000 | 11387267000 |
| Sunday, January 1, 2023 | 3434100000 | 12635892000 |
| Monday, January 1, 2024 | 3569400000 | 12801816000 |
Data in motion
In the ever-evolving landscape of industrial manufacturing, Parker-Hannifin Corporation and Lennox International Inc. stand as titans. From 2014 to 2024, these companies have showcased a dynamic shift in their cost of revenue, reflecting broader industry trends. Parker-Hannifin, a leader in motion and control technologies, has seen its cost of revenue grow by approximately 26% over the decade, peaking in 2024. Meanwhile, Lennox International, a key player in climate control solutions, experienced a 45% increase, highlighting its strategic expansions and market adaptations.
This analysis offers a window into the strategic maneuvers of these industrial giants, providing valuable insights for investors and industry enthusiasts alike.
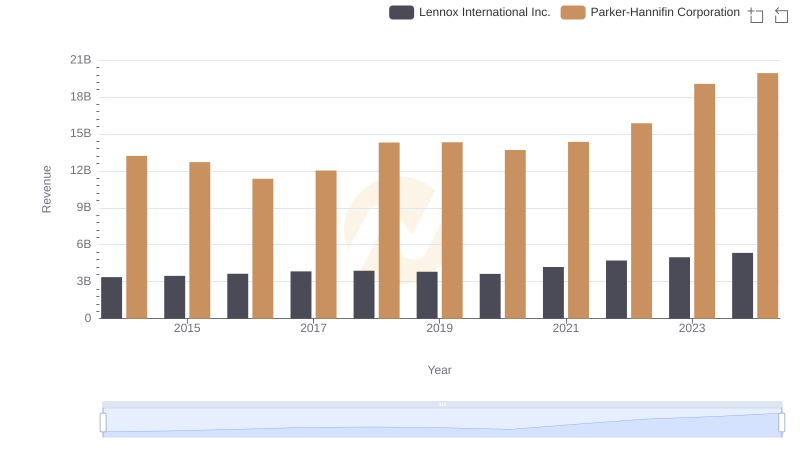
Annual Revenue Comparison: Parker-Hannifin Corporation vs Lennox International Inc.
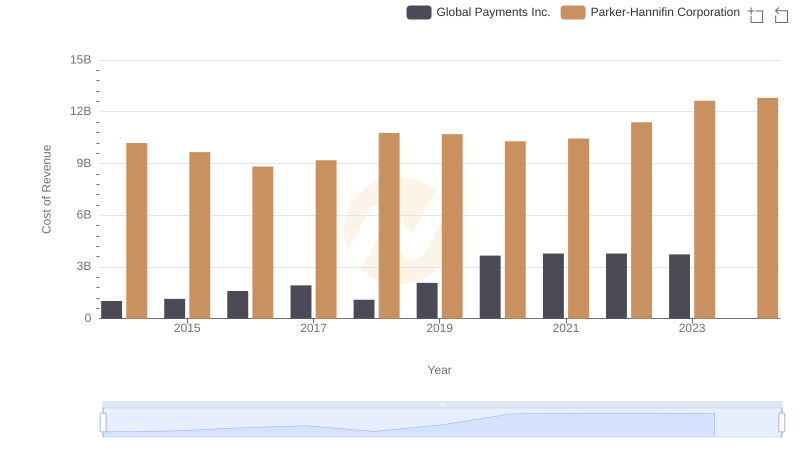
Cost Insights: Breaking Down Parker-Hannifin Corporation and Global Payments Inc.'s Expenses
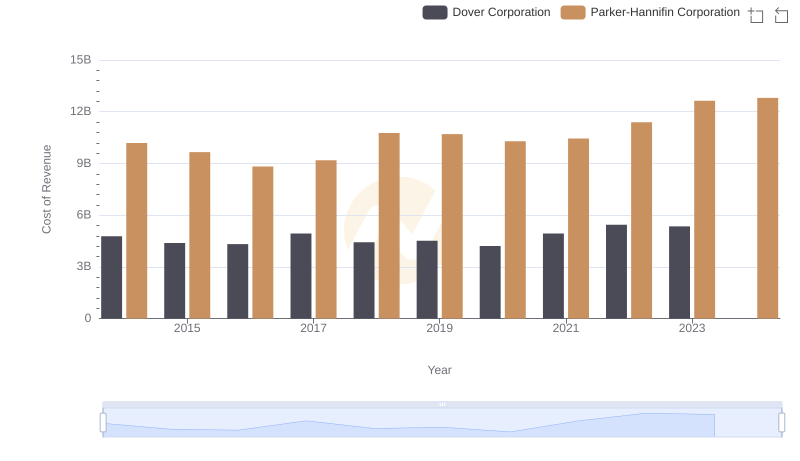
Cost Insights: Breaking Down Parker-Hannifin Corporation and Dover Corporation's Expenses
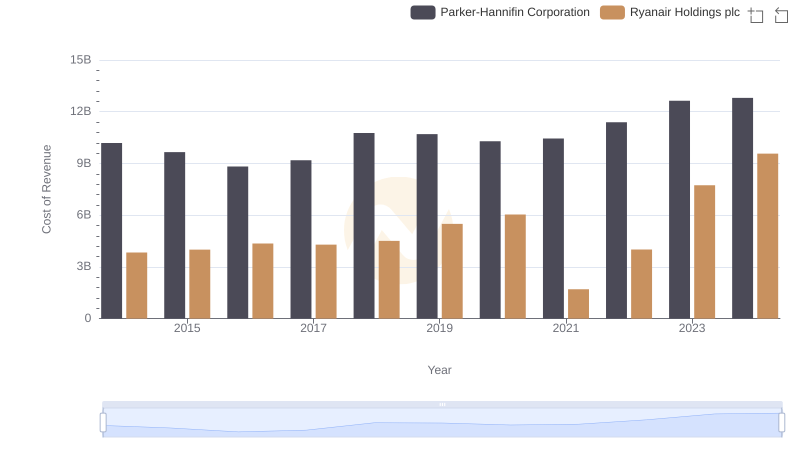
Cost Insights: Breaking Down Parker-Hannifin Corporation and Ryanair Holdings plc's Expenses

Analyzing Cost of Revenue: Parker-Hannifin Corporation and Builders FirstSource, Inc.
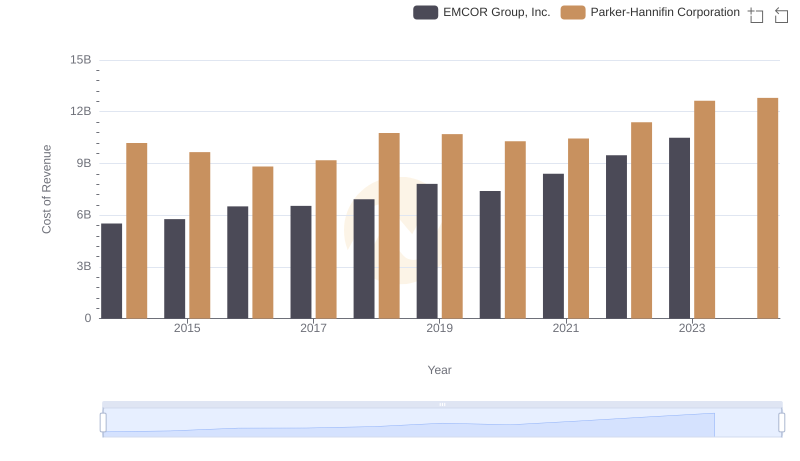
Cost Insights: Breaking Down Parker-Hannifin Corporation and EMCOR Group, Inc.'s Expenses
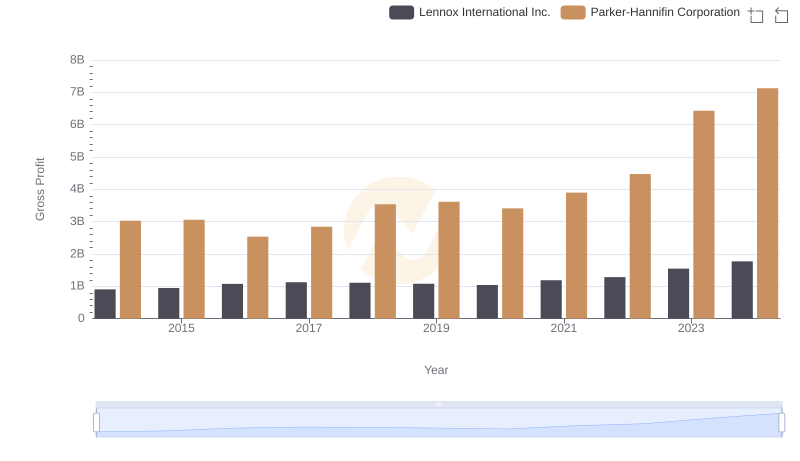
Gross Profit Comparison: Parker-Hannifin Corporation and Lennox International Inc. Trends
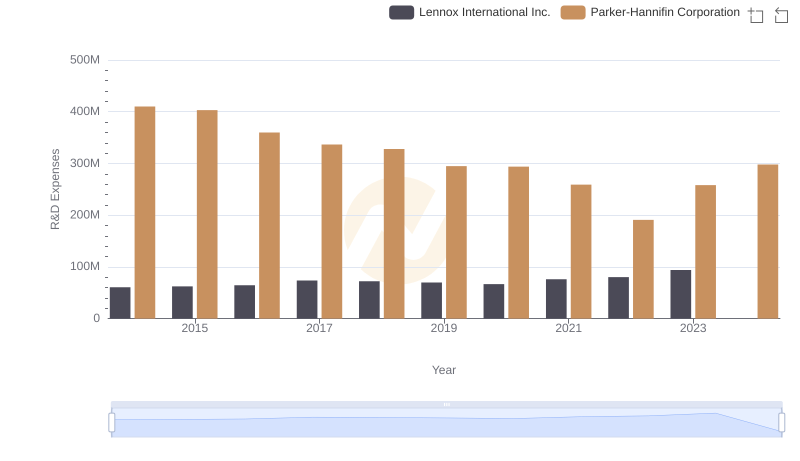
Research and Development: Comparing Key Metrics for Parker-Hannifin Corporation and Lennox International Inc.
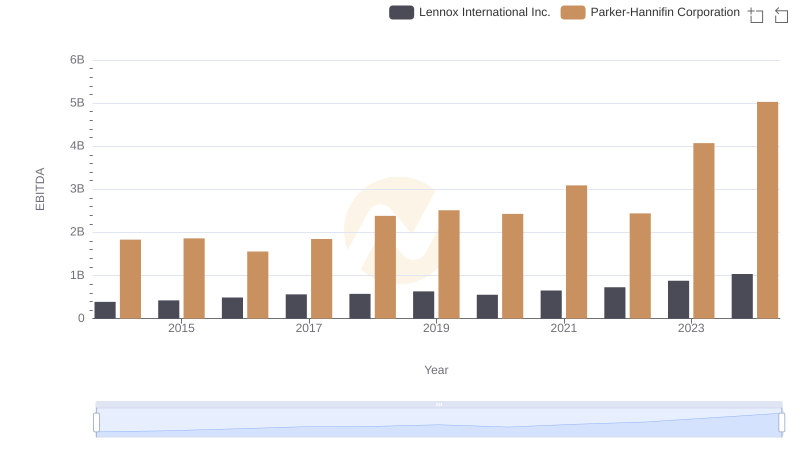
Professional EBITDA Benchmarking: Parker-Hannifin Corporation vs Lennox International Inc.