| __timestamp | Parker-Hannifin Corporation | Stanley Black & Decker, Inc. |
|---|---|---|
| Wednesday, January 1, 2014 | 10188227000 | 7235900000 |
| Thursday, January 1, 2015 | 9655245000 | 7099800000 |
| Friday, January 1, 2016 | 8823384000 | 7139700000 |
| Sunday, January 1, 2017 | 9188962000 | 7969200000 |
| Monday, January 1, 2018 | 10762841000 | 9080500000 |
| Tuesday, January 1, 2019 | 10703484000 | 9636700000 |
| Wednesday, January 1, 2020 | 10286518000 | 9566700000 |
| Friday, January 1, 2021 | 10449680000 | 10423000000 |
| Saturday, January 1, 2022 | 11387267000 | 12663300000 |
| Sunday, January 1, 2023 | 12635892000 | 11683100000 |
| Monday, January 1, 2024 | 12801816000 | 10851300000 |
Igniting the spark of knowledge
In the ever-evolving landscape of industrial manufacturing, Parker-Hannifin Corporation and Stanley Black & Decker, Inc. have been pivotal players. From 2014 to 2023, Parker-Hannifin's cost of revenue has shown a steady upward trajectory, peaking at approximately 28% higher in 2023 compared to 2014. Meanwhile, Stanley Black & Decker experienced a similar upward trend, with a notable 75% increase in cost of revenue from 2014 to 2022. However, data for 2024 is missing for Stanley Black & Decker, leaving a gap in the comparative analysis. This trend reflects the broader industry dynamics, where companies are navigating through supply chain challenges and fluctuating demand. As these giants continue to innovate, understanding their cost structures provides valuable insights into their strategic priorities and market positioning.
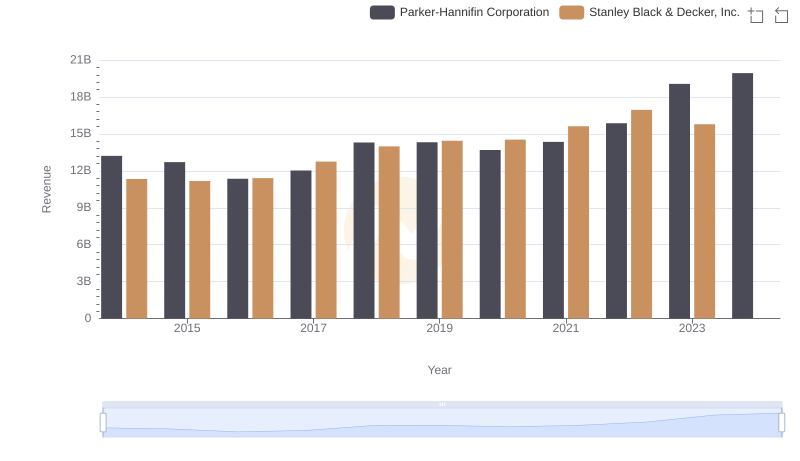
Parker-Hannifin Corporation and Stanley Black & Decker, Inc.: A Comprehensive Revenue Analysis
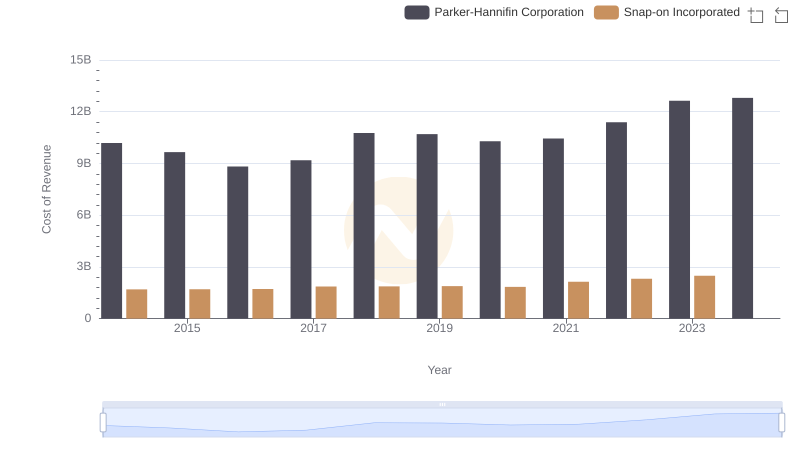
Analyzing Cost of Revenue: Parker-Hannifin Corporation and Snap-on Incorporated

Parker-Hannifin Corporation and Stanley Black & Decker, Inc.: A Detailed Gross Profit Analysis

Research and Development Expenses Breakdown: Parker-Hannifin Corporation vs Stanley Black & Decker, Inc.
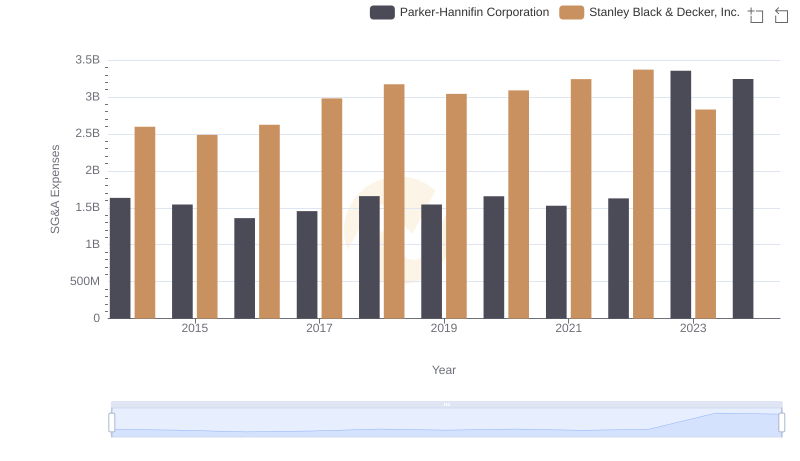
Operational Costs Compared: SG&A Analysis of Parker-Hannifin Corporation and Stanley Black & Decker, Inc.
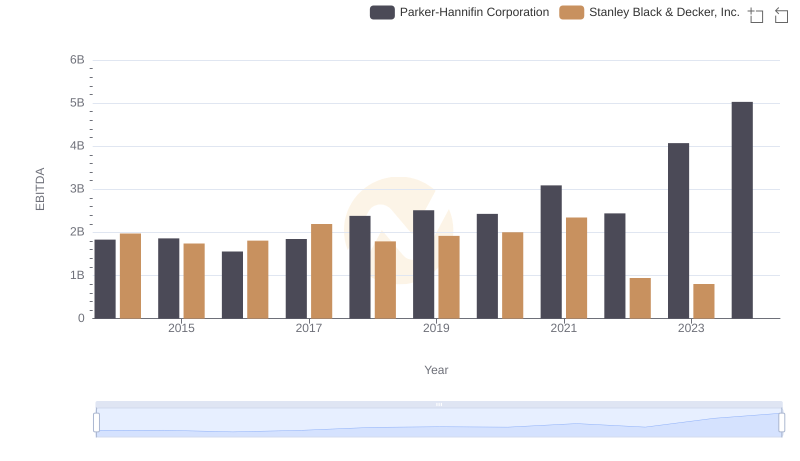
Comparative EBITDA Analysis: Parker-Hannifin Corporation vs Stanley Black & Decker, Inc.

Parker-Hannifin Corporation and Stanley Black & Decker, Inc.: A Comprehensive Revenue Analysis
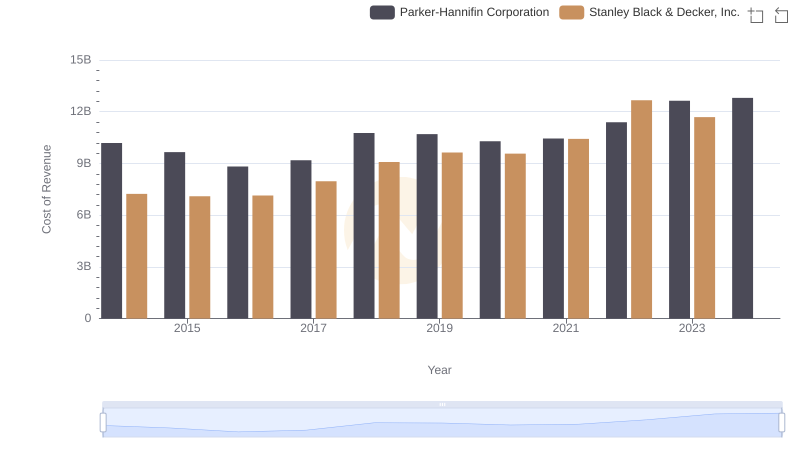
Analyzing Cost of Revenue: Parker-Hannifin Corporation and Stanley Black & Decker, Inc.
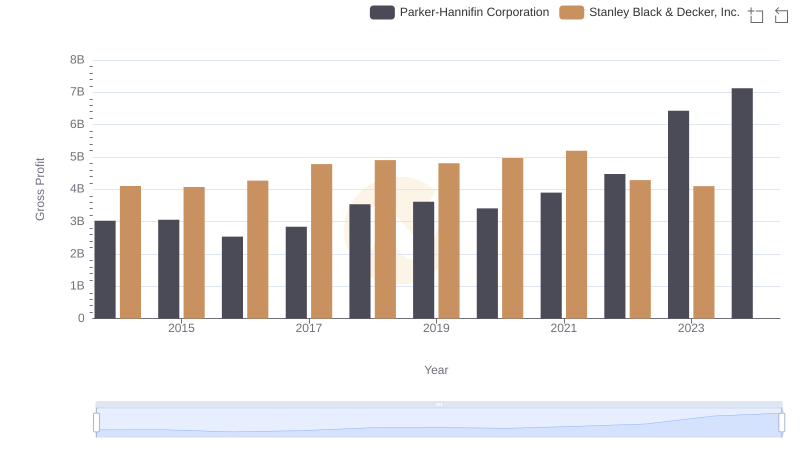
Gross Profit Comparison: Parker-Hannifin Corporation and Stanley Black & Decker, Inc. Trends
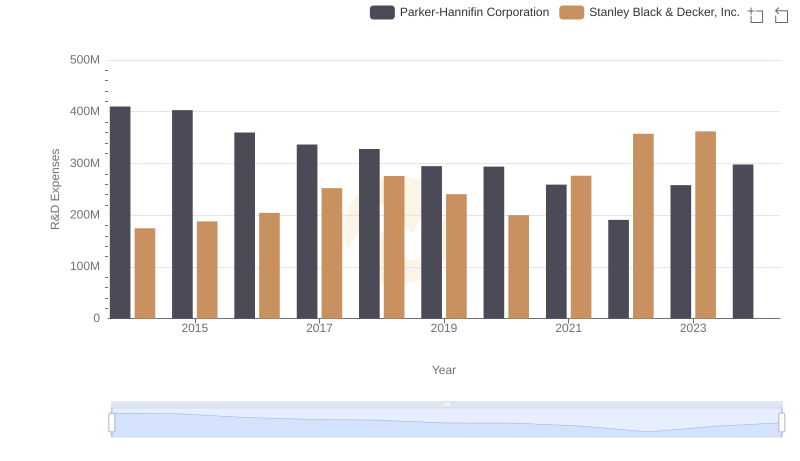
Parker-Hannifin Corporation or Stanley Black & Decker, Inc.: Who Invests More in Innovation?

Parker-Hannifin Corporation vs Stanley Black & Decker, Inc.: In-Depth EBITDA Performance Comparison