| __timestamp | Parker-Hannifin Corporation | Snap-on Incorporated |
|---|---|---|
| Wednesday, January 1, 2014 | 10188227000 | 1693400000 |
| Thursday, January 1, 2015 | 9655245000 | 1704500000 |
| Friday, January 1, 2016 | 8823384000 | 1720800000 |
| Sunday, January 1, 2017 | 9188962000 | 1862000000 |
| Monday, January 1, 2018 | 10762841000 | 1870700000 |
| Tuesday, January 1, 2019 | 10703484000 | 1886000000 |
| Wednesday, January 1, 2020 | 10286518000 | 1844000000 |
| Friday, January 1, 2021 | 10449680000 | 2141200000 |
| Saturday, January 1, 2022 | 11387267000 | 2311700000 |
| Sunday, January 1, 2023 | 12635892000 | 2488500000 |
| Monday, January 1, 2024 | 12801816000 | 2329500000 |
Data in motion
In the ever-evolving landscape of industrial manufacturing, understanding cost dynamics is crucial. Parker-Hannifin Corporation and Snap-on Incorporated, two giants in the sector, have shown distinct trends in their cost of revenue over the past decade. From 2014 to 2023, Parker-Hannifin's cost of revenue surged by approximately 25%, peaking in 2023. This growth reflects their strategic expansions and increased production capabilities. In contrast, Snap-on's cost of revenue grew by about 47% during the same period, indicating a robust increase in operational activities. Notably, 2024 data for Snap-on is missing, leaving room for speculation on their future trajectory. These insights highlight the importance of cost management in maintaining competitive advantage and profitability in the industrial sector. As we look to the future, monitoring these trends will be key for stakeholders and investors alike.

Analyzing Cost of Revenue: Parker-Hannifin Corporation and Builders FirstSource, Inc.
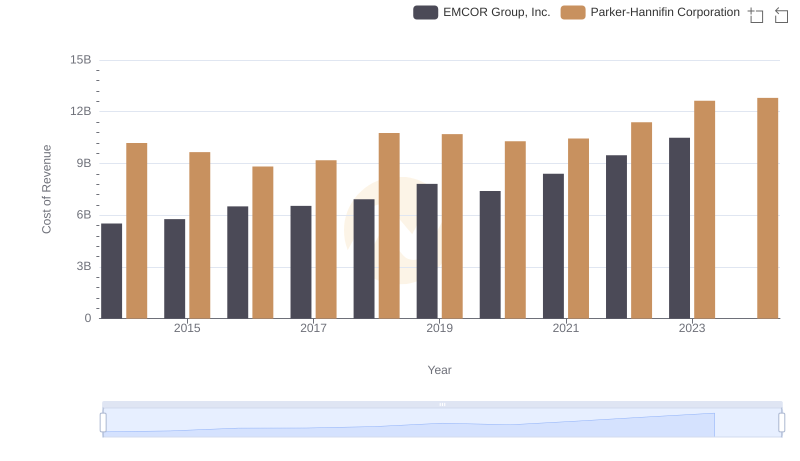
Cost Insights: Breaking Down Parker-Hannifin Corporation and EMCOR Group, Inc.'s Expenses
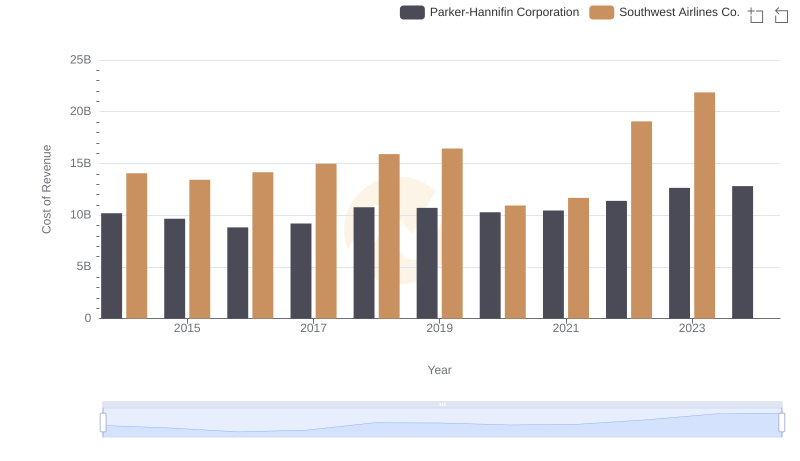
Comparing Cost of Revenue Efficiency: Parker-Hannifin Corporation vs Southwest Airlines Co.

Cost of Revenue Comparison: Parker-Hannifin Corporation vs TransUnion
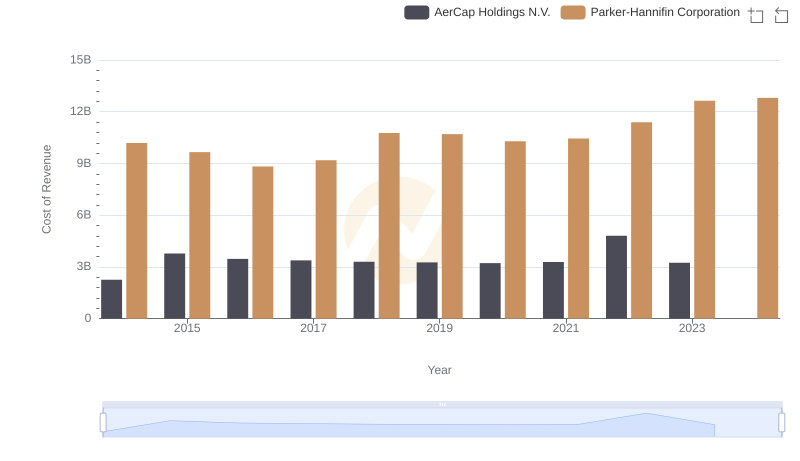
Cost of Revenue Trends: Parker-Hannifin Corporation vs AerCap Holdings N.V.
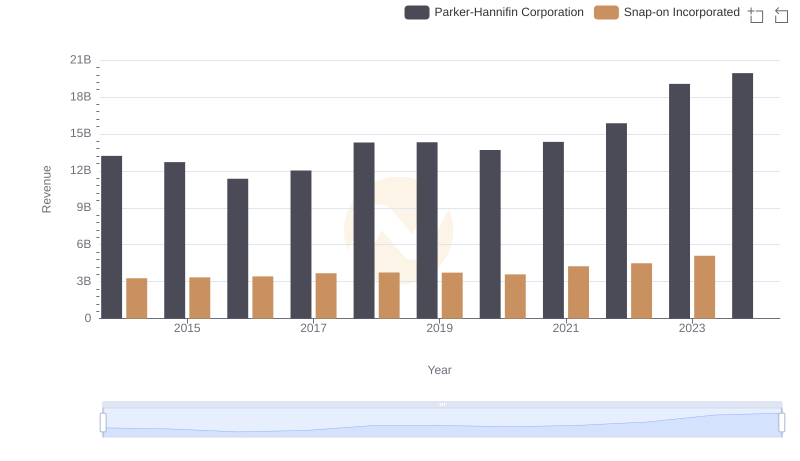
Revenue Showdown: Parker-Hannifin Corporation vs Snap-on Incorporated

Cost of Revenue Trends: Parker-Hannifin Corporation vs Stanley Black & Decker, Inc.
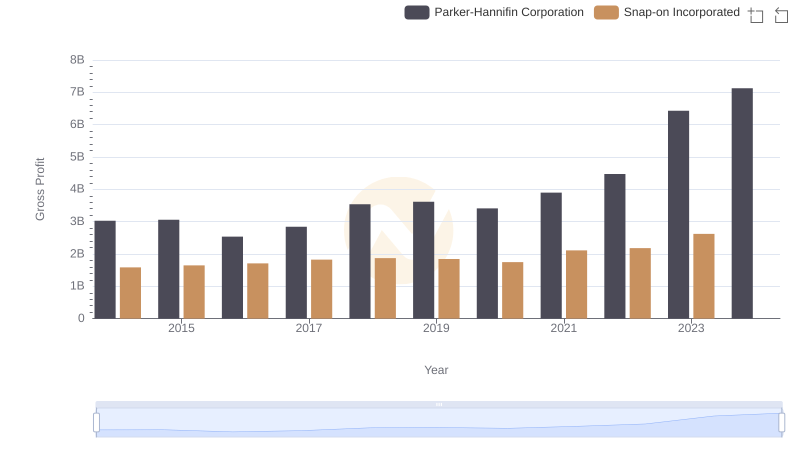
Gross Profit Trends Compared: Parker-Hannifin Corporation vs Snap-on Incorporated
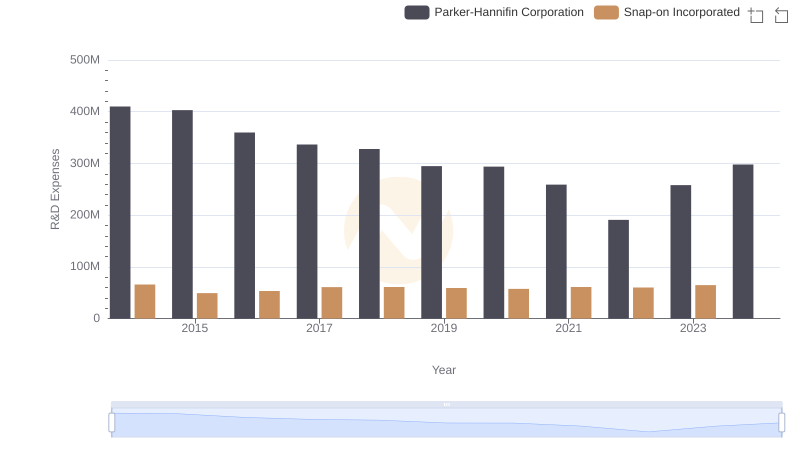
Research and Development Expenses Breakdown: Parker-Hannifin Corporation vs Snap-on Incorporated
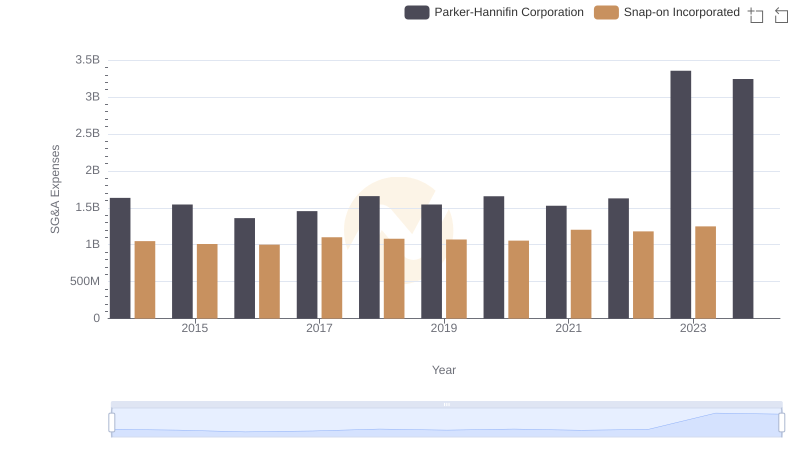
SG&A Efficiency Analysis: Comparing Parker-Hannifin Corporation and Snap-on Incorporated
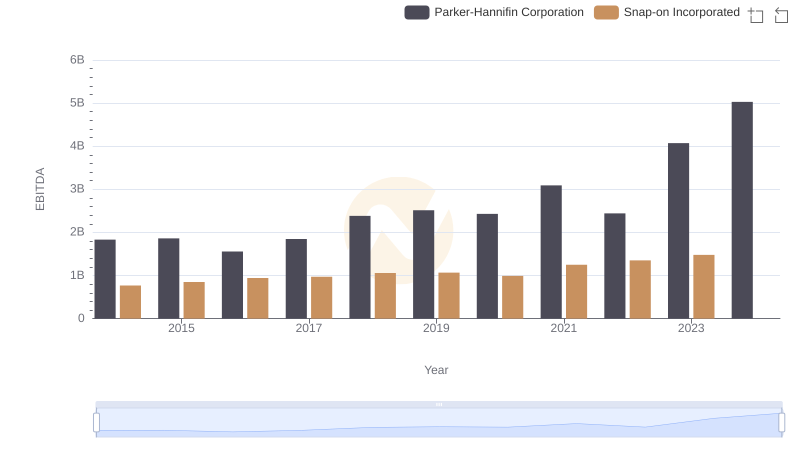
EBITDA Performance Review: Parker-Hannifin Corporation vs Snap-on Incorporated