| __timestamp | EMCOR Group, Inc. | Parker-Hannifin Corporation |
|---|---|---|
| Wednesday, January 1, 2014 | 5517719000 | 10188227000 |
| Thursday, January 1, 2015 | 5774247000 | 9655245000 |
| Friday, January 1, 2016 | 6513662000 | 8823384000 |
| Sunday, January 1, 2017 | 6539987000 | 9188962000 |
| Monday, January 1, 2018 | 6925178000 | 10762841000 |
| Tuesday, January 1, 2019 | 7818743000 | 10703484000 |
| Wednesday, January 1, 2020 | 7401679000 | 10286518000 |
| Friday, January 1, 2021 | 8401843000 | 10449680000 |
| Saturday, January 1, 2022 | 9472526000 | 11387267000 |
| Sunday, January 1, 2023 | 10493534000 | 12635892000 |
| Monday, January 1, 2024 | 12801816000 |
In pursuit of knowledge
In the ever-evolving landscape of industrial manufacturing and construction services, understanding cost dynamics is crucial. Parker-Hannifin Corporation and EMCOR Group, Inc. have been pivotal players in their respective fields. From 2014 to 2023, Parker-Hannifin's cost of revenue has shown a steady increase, peaking at approximately $12.6 billion in 2023, marking a 24% rise from 2014. Meanwhile, EMCOR Group's cost of revenue surged by 90% over the same period, reaching around $10.5 billion in 2023. This growth reflects their strategic expansions and market adaptations. Notably, Parker-Hannifin's costs consistently surpassed EMCOR's, highlighting its larger scale of operations. However, the data for 2024 is incomplete, leaving room for speculation on future trends. These insights offer a glimpse into the financial strategies of these industrial titans, providing valuable lessons for stakeholders and investors alike.
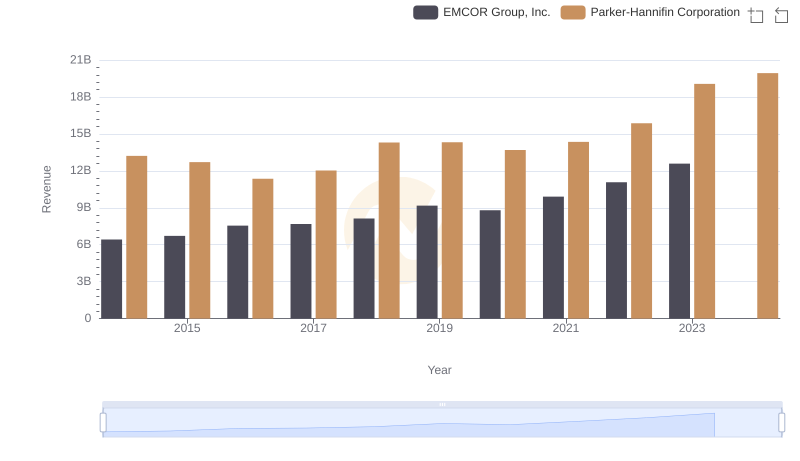
Who Generates More Revenue? Parker-Hannifin Corporation or EMCOR Group, Inc.
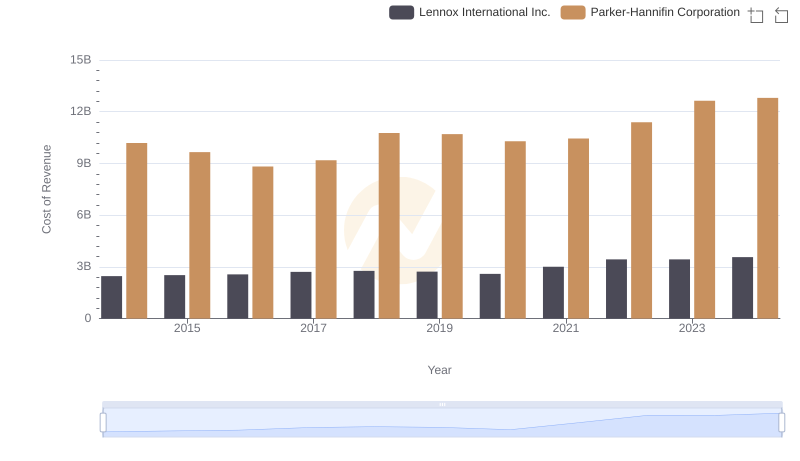
Analyzing Cost of Revenue: Parker-Hannifin Corporation and Lennox International Inc.

Analyzing Cost of Revenue: Parker-Hannifin Corporation and Builders FirstSource, Inc.
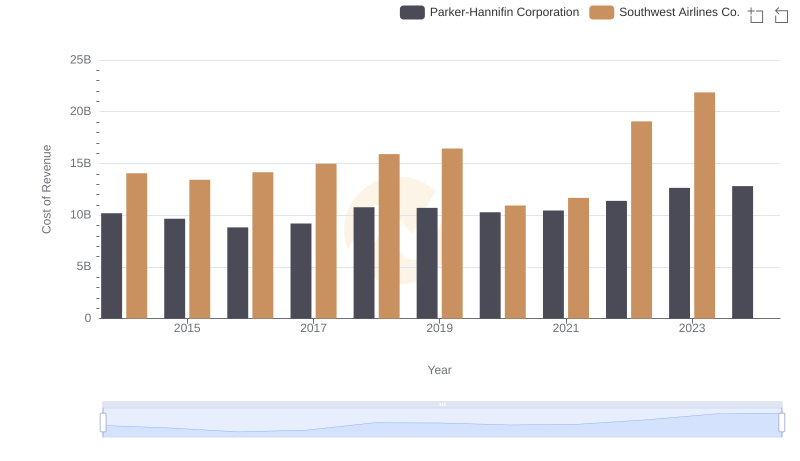
Comparing Cost of Revenue Efficiency: Parker-Hannifin Corporation vs Southwest Airlines Co.

Cost of Revenue Comparison: Parker-Hannifin Corporation vs TransUnion
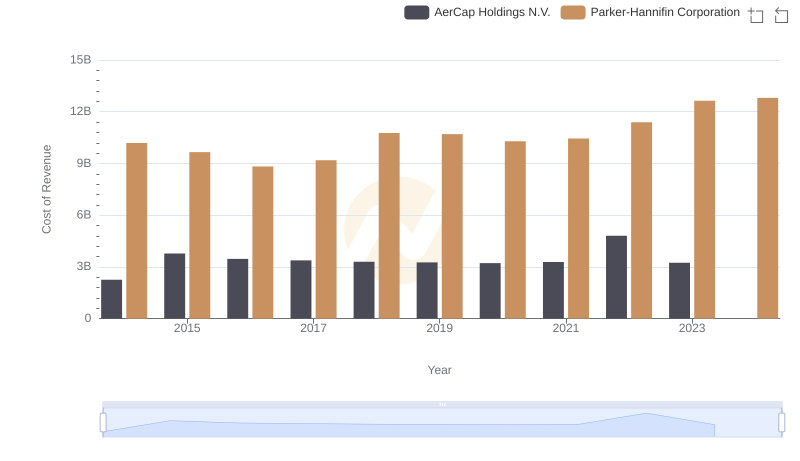
Cost of Revenue Trends: Parker-Hannifin Corporation vs AerCap Holdings N.V.
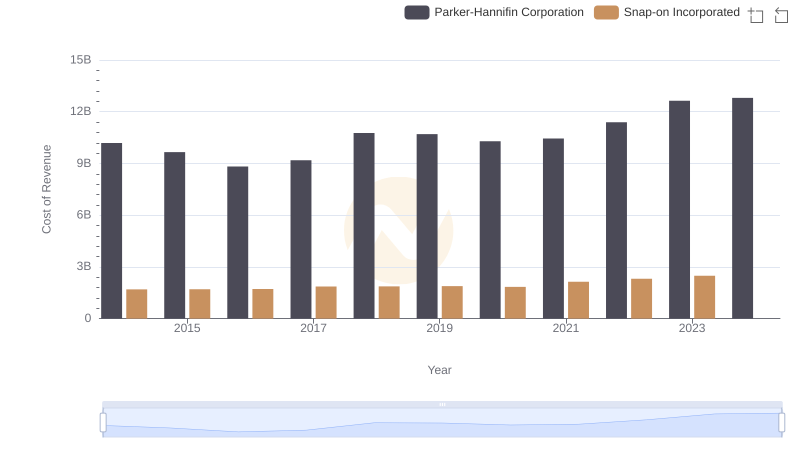
Analyzing Cost of Revenue: Parker-Hannifin Corporation and Snap-on Incorporated
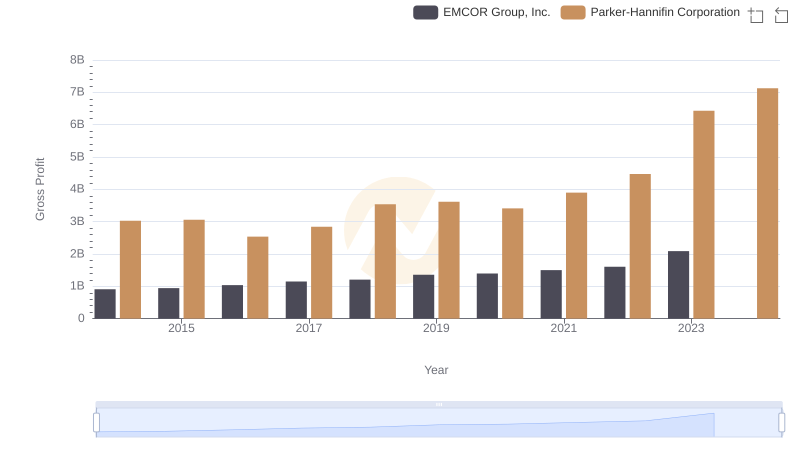
Who Generates Higher Gross Profit? Parker-Hannifin Corporation or EMCOR Group, Inc.
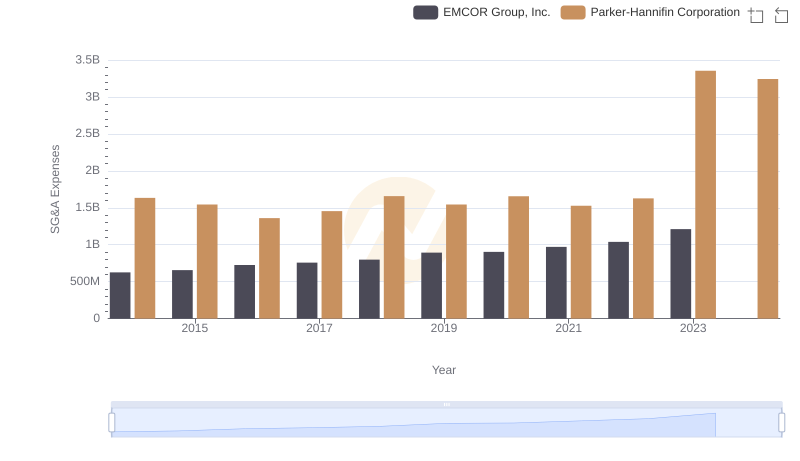
Who Optimizes SG&A Costs Better? Parker-Hannifin Corporation or EMCOR Group, Inc.
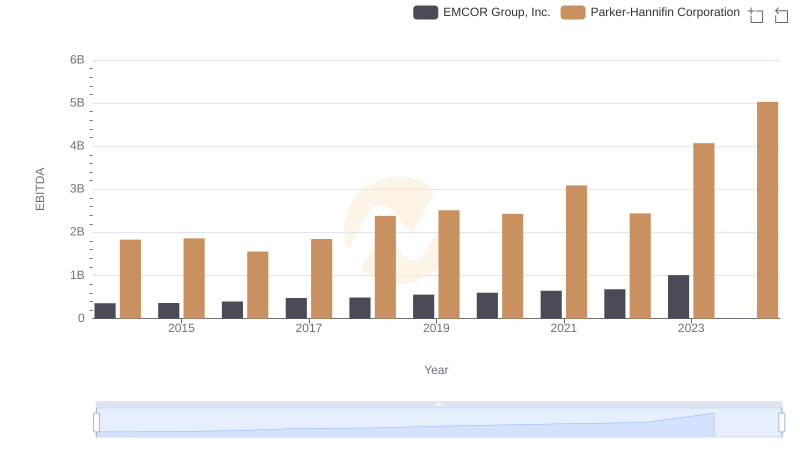
Comprehensive EBITDA Comparison: Parker-Hannifin Corporation vs EMCOR Group, Inc.