| __timestamp | Parker-Hannifin Corporation | TransUnion |
|---|---|---|
| Wednesday, January 1, 2014 | 10188227000 | 499100000 |
| Thursday, January 1, 2015 | 9655245000 | 531600000 |
| Friday, January 1, 2016 | 8823384000 | 579100000 |
| Sunday, January 1, 2017 | 9188962000 | 645700000 |
| Monday, January 1, 2018 | 10762841000 | 790100000 |
| Tuesday, January 1, 2019 | 10703484000 | 874100000 |
| Wednesday, January 1, 2020 | 10286518000 | 920400000 |
| Friday, January 1, 2021 | 10449680000 | 991600000 |
| Saturday, January 1, 2022 | 11387267000 | 1222900000 |
| Sunday, January 1, 2023 | 12635892000 | 1517300000 |
| Monday, January 1, 2024 | 12801816000 | 0 |
Unleashing insights
In the ever-evolving landscape of American industry, Parker-Hannifin Corporation and TransUnion stand as titans in their respective fields. Over the past decade, Parker-Hannifin, a leader in motion and control technologies, has consistently outpaced TransUnion, a global information and insights company, in terms of cost of revenue. From 2014 to 2023, Parker-Hannifin's cost of revenue surged by approximately 26%, peaking at an impressive $12.6 billion in 2023. In contrast, TransUnion's cost of revenue grew by over 200% during the same period, reaching $1.5 billion in 2023.
While Parker-Hannifin's growth reflects its robust expansion and operational efficiency, TransUnion's rapid increase highlights its aggressive market penetration and data-driven strategies. However, the data for 2024 remains incomplete, leaving room for speculation on future trends. As these companies continue to navigate the complexities of their industries, their financial trajectories offer valuable insights into the broader economic landscape.
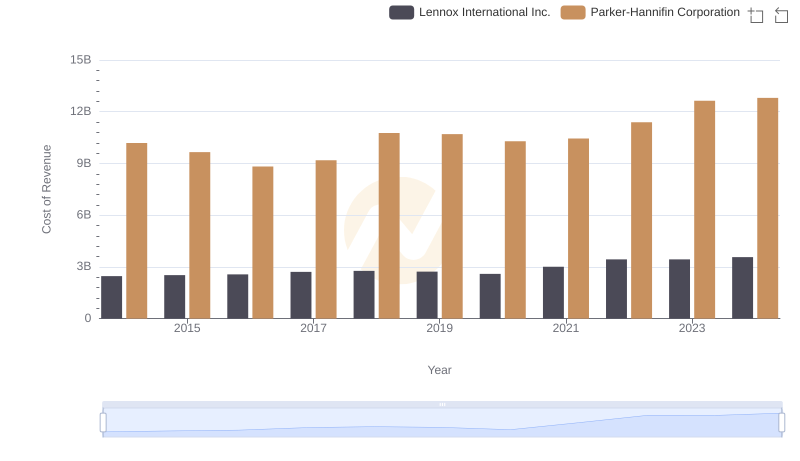
Analyzing Cost of Revenue: Parker-Hannifin Corporation and Lennox International Inc.

Analyzing Cost of Revenue: Parker-Hannifin Corporation and Builders FirstSource, Inc.
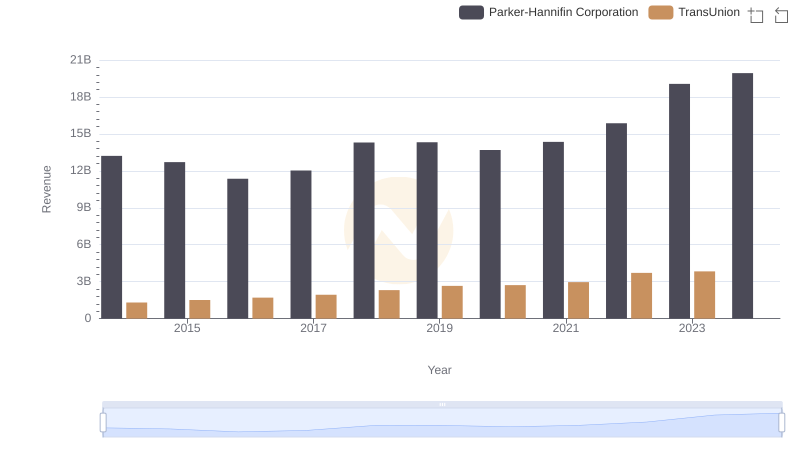
Parker-Hannifin Corporation or TransUnion: Who Leads in Yearly Revenue?
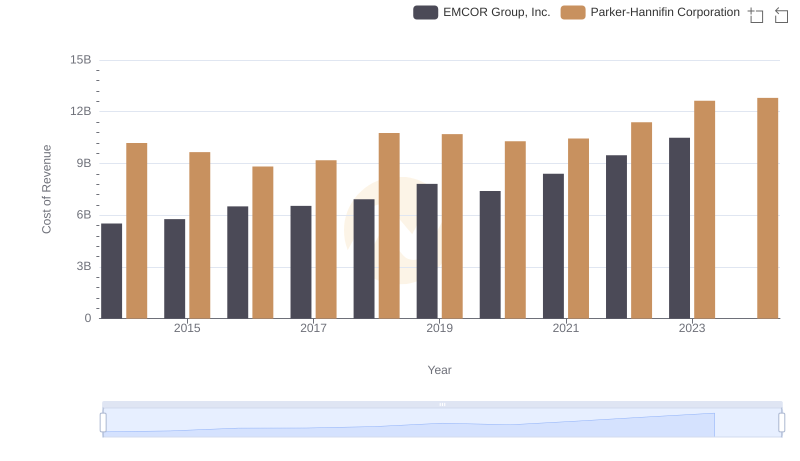
Cost Insights: Breaking Down Parker-Hannifin Corporation and EMCOR Group, Inc.'s Expenses
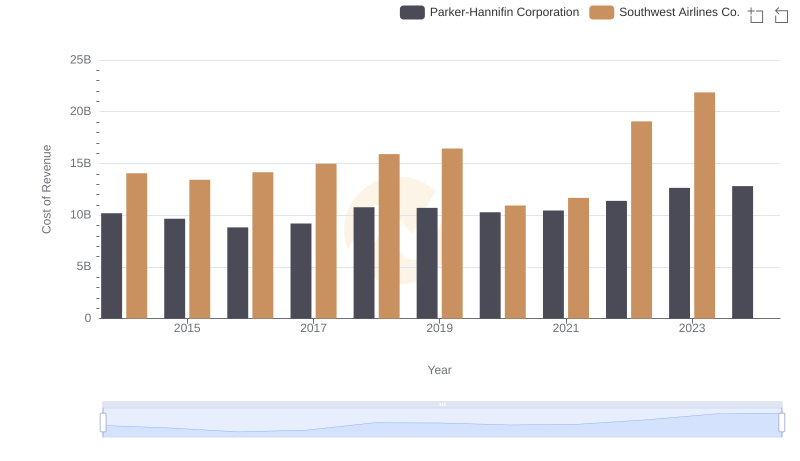
Comparing Cost of Revenue Efficiency: Parker-Hannifin Corporation vs Southwest Airlines Co.
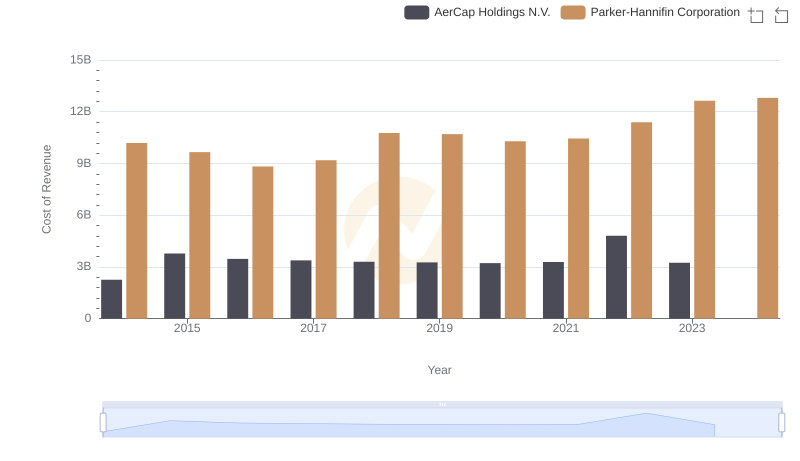
Cost of Revenue Trends: Parker-Hannifin Corporation vs AerCap Holdings N.V.
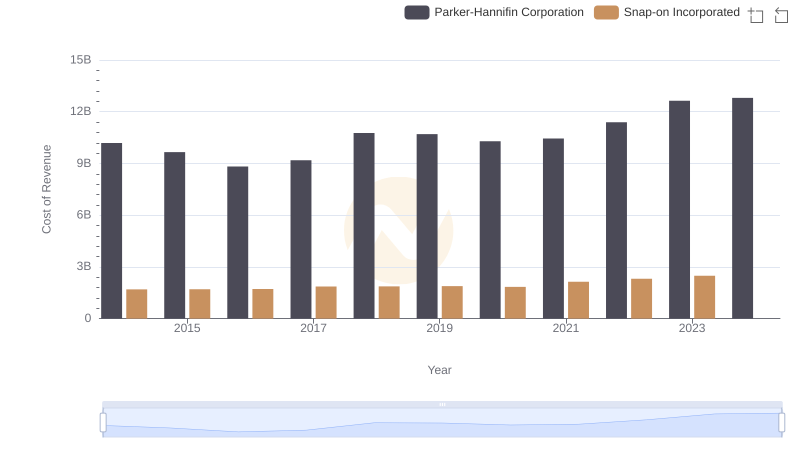
Analyzing Cost of Revenue: Parker-Hannifin Corporation and Snap-on Incorporated

Cost of Revenue Trends: Parker-Hannifin Corporation vs Stanley Black & Decker, Inc.
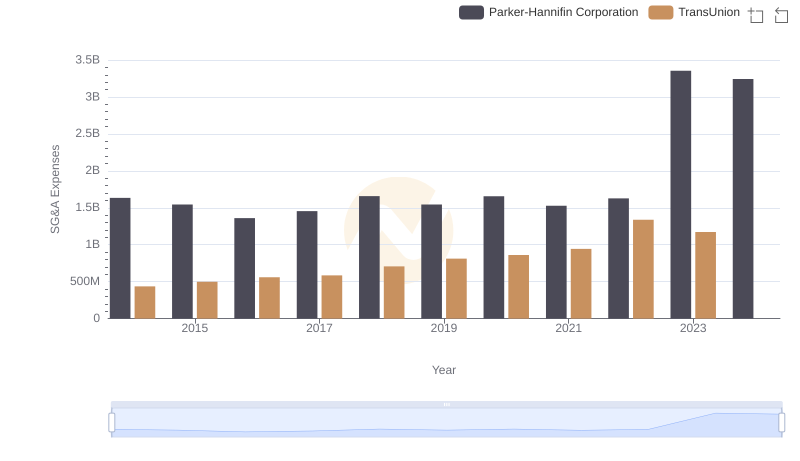
Selling, General, and Administrative Costs: Parker-Hannifin Corporation vs TransUnion