| __timestamp | Lennox International Inc. | TFI International Inc. |
|---|---|---|
| Wednesday, January 1, 2014 | 2464100000 | 2782605137 |
| Thursday, January 1, 2015 | 2520000000 | 2551474032 |
| Friday, January 1, 2016 | 2565100000 | 2636493564 |
| Sunday, January 1, 2017 | 2714400000 | 3364979721 |
| Monday, January 1, 2018 | 2772700000 | 3251443800 |
| Tuesday, January 1, 2019 | 2727400000 | 3461987950 |
| Wednesday, January 1, 2020 | 2594000000 | 3239249000 |
| Friday, January 1, 2021 | 3005700000 | 6182566000 |
| Saturday, January 1, 2022 | 3433700000 | 7385640000 |
| Sunday, January 1, 2023 | 3434100000 | 6255775000 |
| Monday, January 1, 2024 | 3569400000 |
In pursuit of knowledge
In the ever-evolving landscape of industrial giants, Lennox International Inc. and TFI International Inc. have showcased intriguing cost of revenue trends over the past decade. From 2014 to 2023, Lennox International's cost of revenue has seen a steady climb, peaking at approximately $3.57 billion in 2024, marking a 45% increase from its 2014 figures. Meanwhile, TFI International experienced a more volatile journey, with a significant surge in 2021, reaching a peak of $7.39 billion in 2022, before slightly declining in 2023. This represents a remarkable 165% growth from 2014. The data highlights the dynamic nature of these industries, with TFI International's fluctuations suggesting a more aggressive expansion strategy. However, the absence of 2024 data for TFI International leaves room for speculation on its future trajectory.
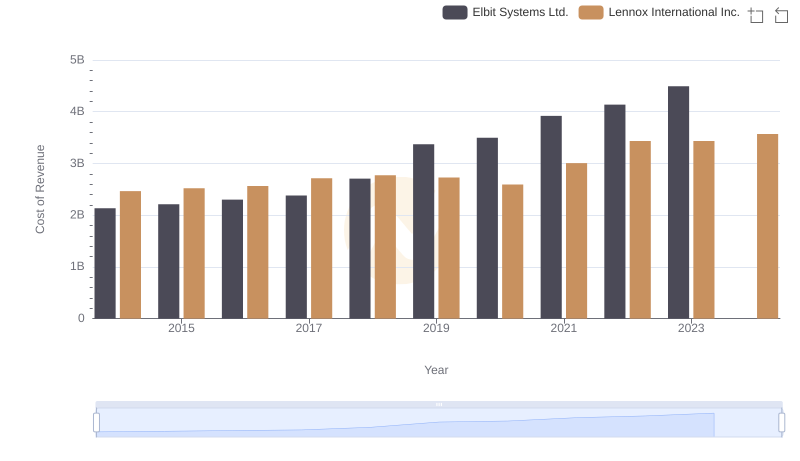
Cost of Revenue: Key Insights for Lennox International Inc. and Elbit Systems Ltd.
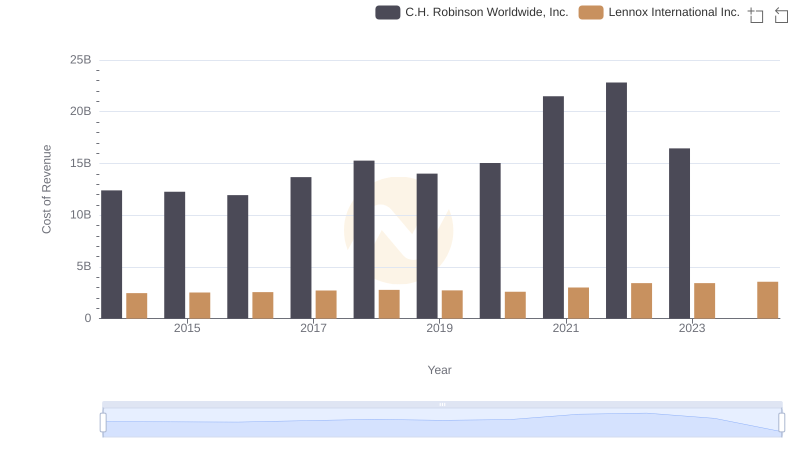
Cost of Revenue: Key Insights for Lennox International Inc. and C.H. Robinson Worldwide, Inc.
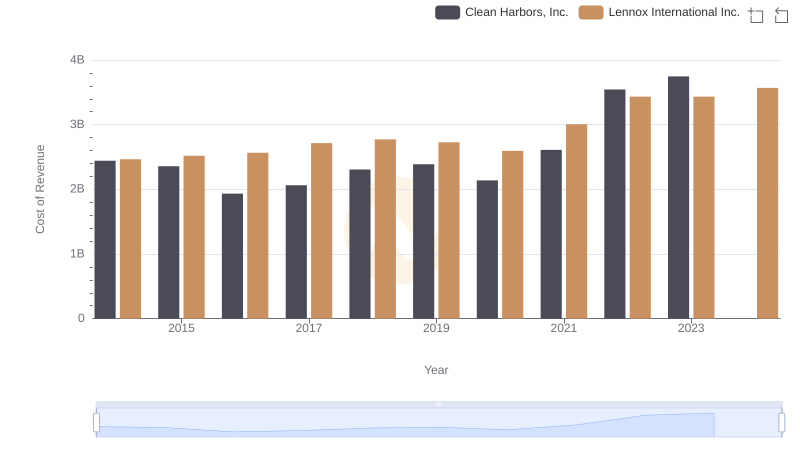
Cost of Revenue Comparison: Lennox International Inc. vs Clean Harbors, Inc.
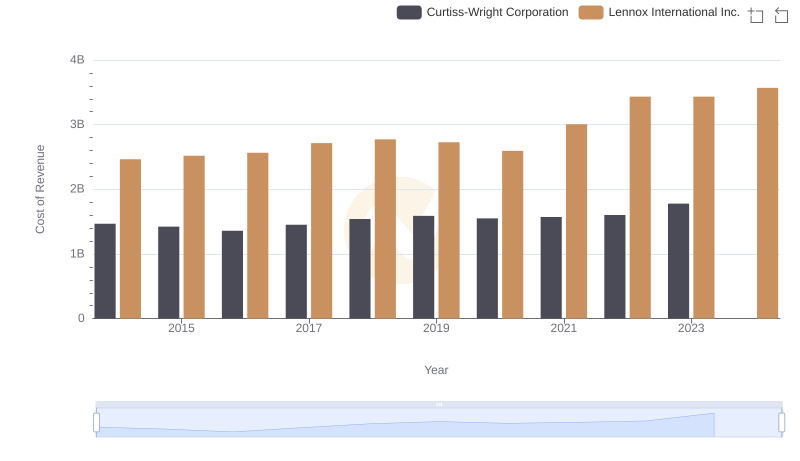
Cost of Revenue Comparison: Lennox International Inc. vs Curtiss-Wright Corporation
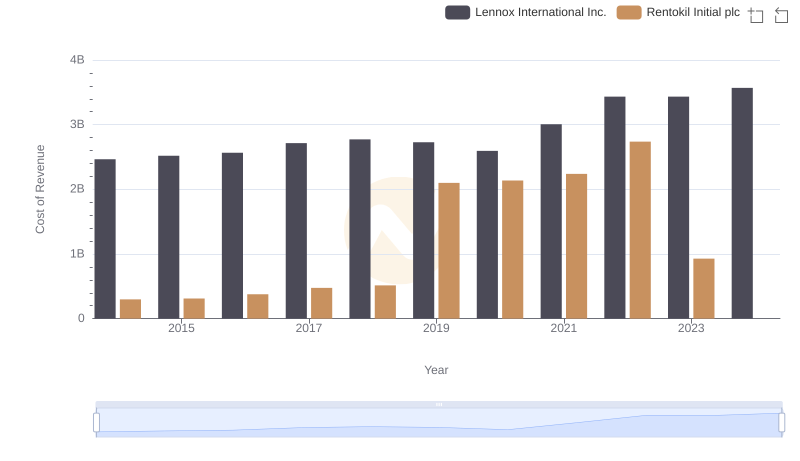
Cost Insights: Breaking Down Lennox International Inc. and Rentokil Initial plc's Expenses
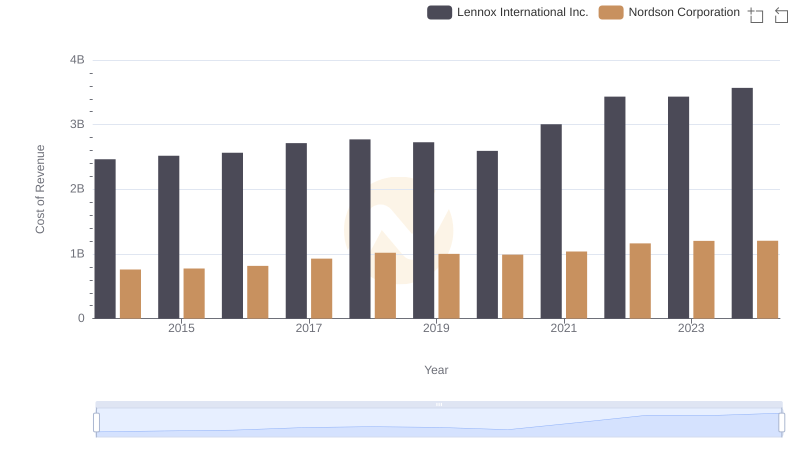
Cost of Revenue: Key Insights for Lennox International Inc. and Nordson Corporation
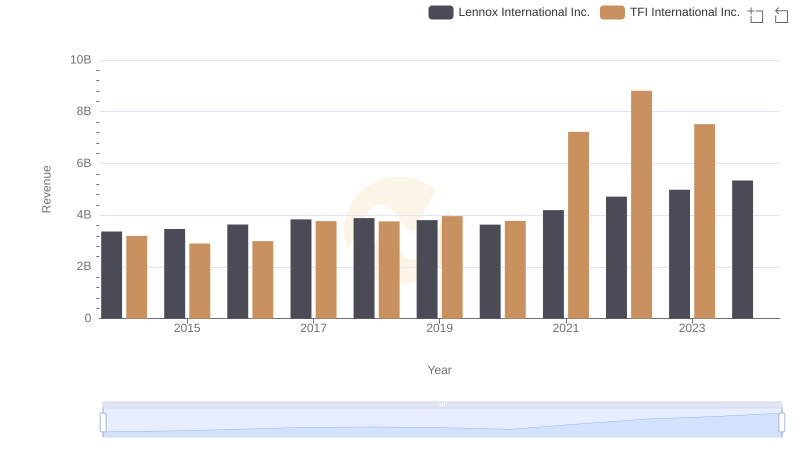
Lennox International Inc. and TFI International Inc.: A Comprehensive Revenue Analysis
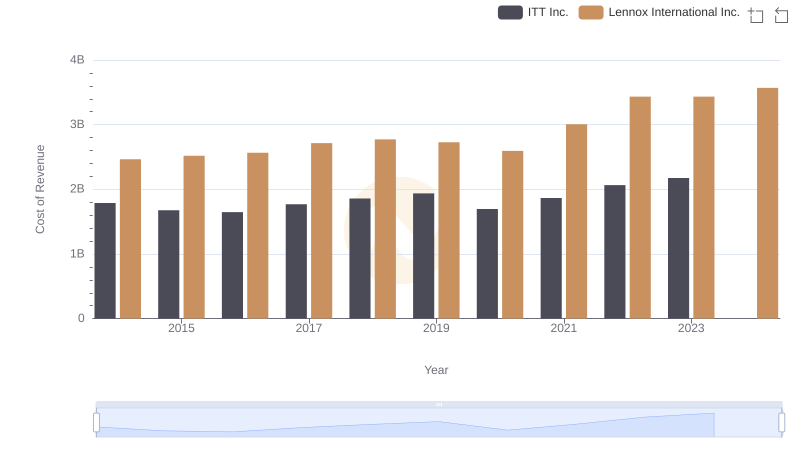
Cost Insights: Breaking Down Lennox International Inc. and ITT Inc.'s Expenses
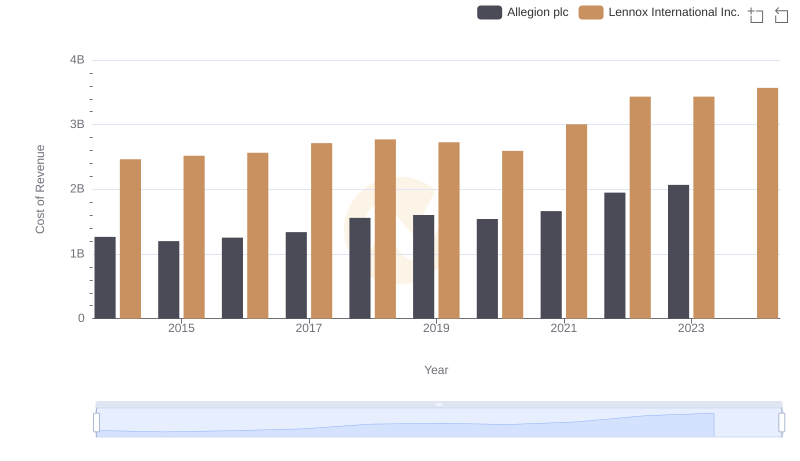
Analyzing Cost of Revenue: Lennox International Inc. and Allegion plc
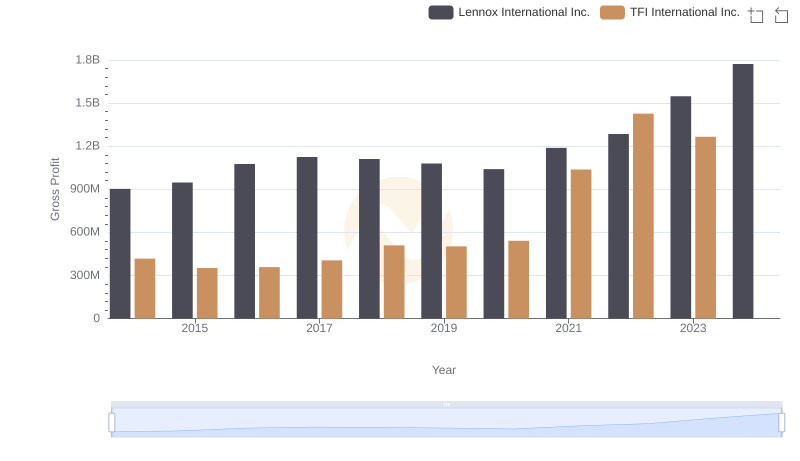
Gross Profit Analysis: Comparing Lennox International Inc. and TFI International Inc.
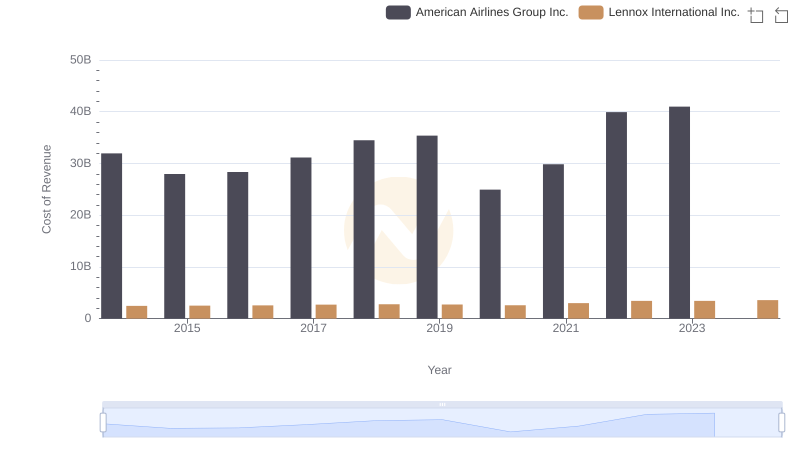
Comparing Cost of Revenue Efficiency: Lennox International Inc. vs American Airlines Group Inc.
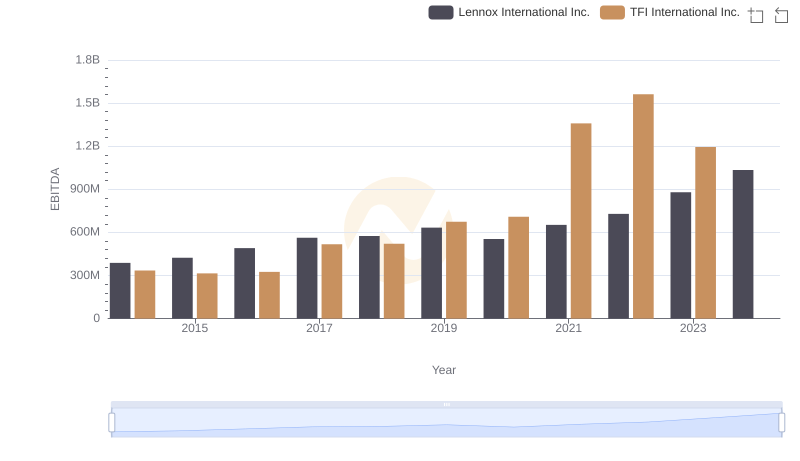
A Professional Review of EBITDA: Lennox International Inc. Compared to TFI International Inc.