| __timestamp | Lennox International Inc. | TFI International Inc. |
|---|---|---|
| Wednesday, January 1, 2014 | 903300000 | 417323364 |
| Thursday, January 1, 2015 | 947400000 | 352552803 |
| Friday, January 1, 2016 | 1076500000 | 358230042 |
| Sunday, January 1, 2017 | 1125200000 | 405214314 |
| Monday, January 1, 2018 | 1111200000 | 510006388 |
| Tuesday, January 1, 2019 | 1079800000 | 502631921 |
| Wednesday, January 1, 2020 | 1040100000 | 541885000 |
| Friday, January 1, 2021 | 1188400000 | 1037863000 |
| Saturday, January 1, 2022 | 1284700000 | 1426851000 |
| Sunday, January 1, 2023 | 1547800000 | 1265392000 |
| Monday, January 1, 2024 | 1771900000 |
Data in motion
In the competitive landscape of industrial giants, Lennox International Inc. and TFI International Inc. have showcased intriguing trends in their gross profit margins over the past decade. From 2014 to 2023, Lennox International Inc. has consistently demonstrated a robust growth trajectory, with its gross profit surging by approximately 96%, peaking in 2023. This growth reflects the company's strategic initiatives and market adaptability.
Conversely, TFI International Inc. experienced a remarkable 240% increase in gross profit from 2014 to 2022, highlighting its aggressive expansion and operational efficiency. However, data for 2024 is currently unavailable, leaving room for speculation on its future performance.
These trends underscore the dynamic nature of the industrial sector, where strategic decisions and market conditions play pivotal roles in shaping financial outcomes. Investors and analysts should keep a keen eye on these companies as they navigate the ever-evolving economic landscape.
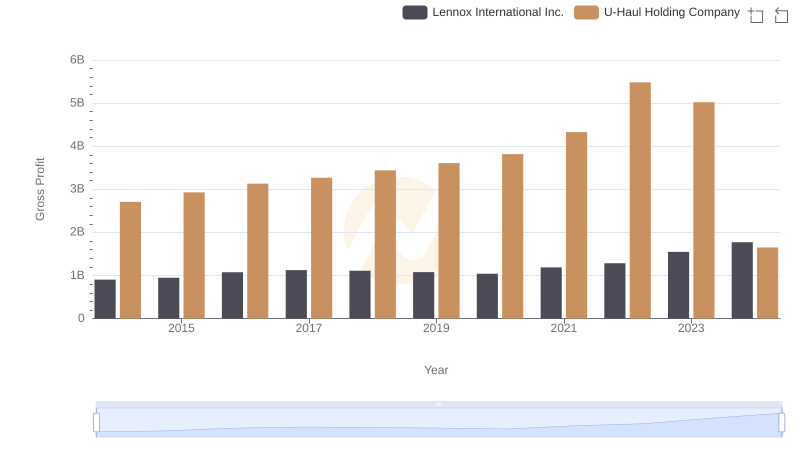
Lennox International Inc. vs U-Haul Holding Company: A Gross Profit Performance Breakdown
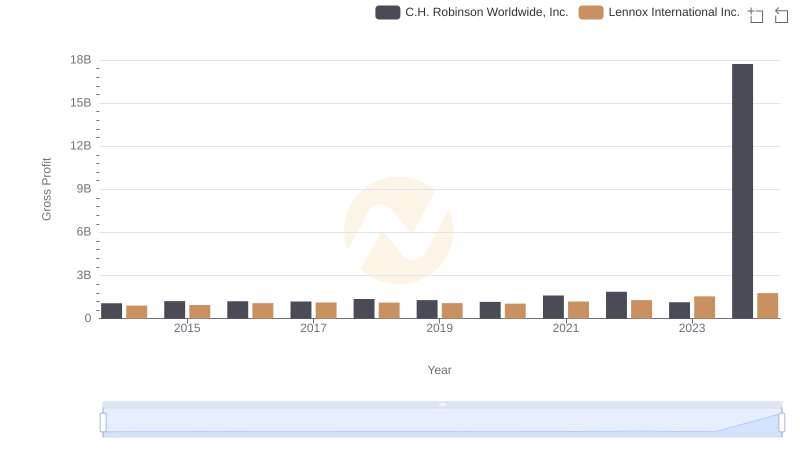
Gross Profit Analysis: Comparing Lennox International Inc. and C.H. Robinson Worldwide, Inc.
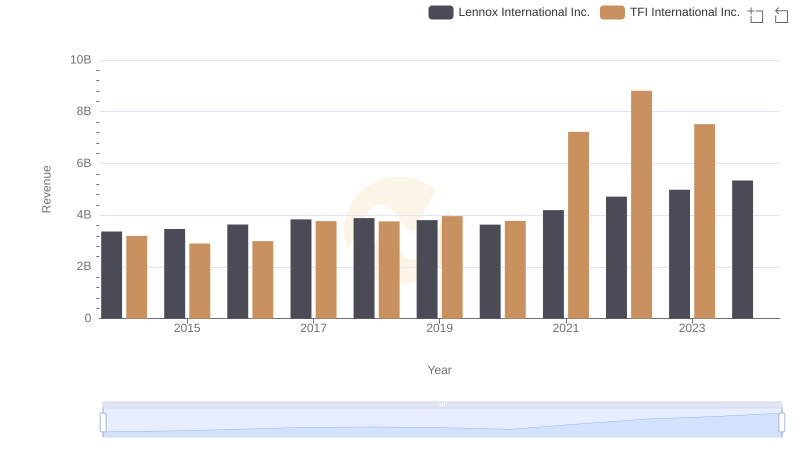
Lennox International Inc. and TFI International Inc.: A Comprehensive Revenue Analysis
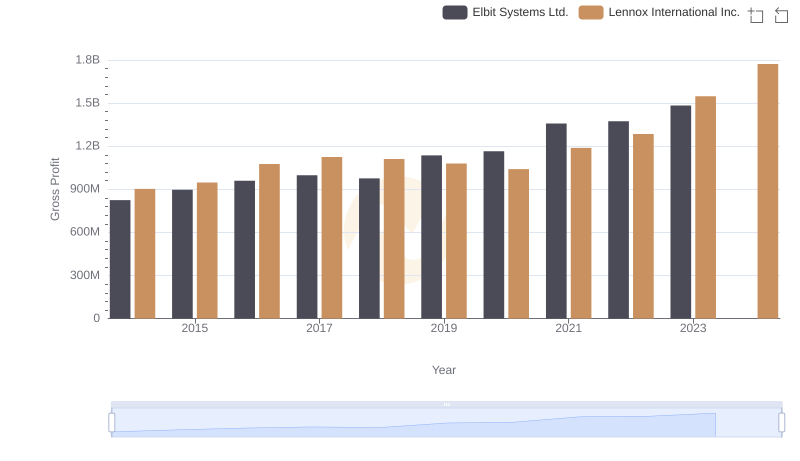
Gross Profit Comparison: Lennox International Inc. and Elbit Systems Ltd. Trends
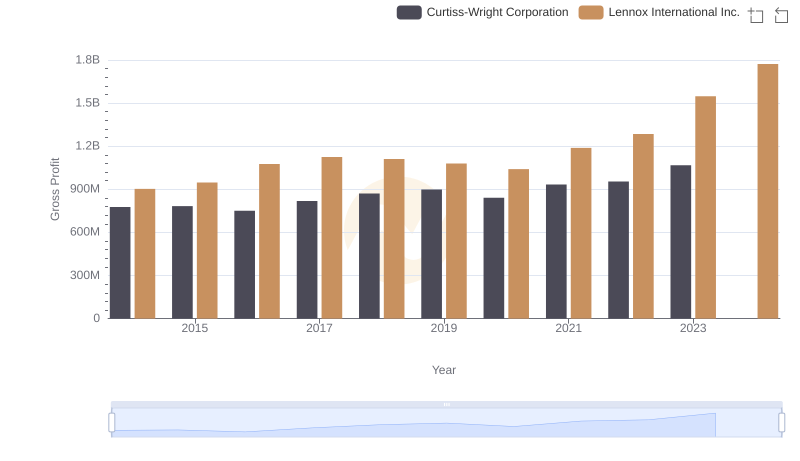
Gross Profit Trends Compared: Lennox International Inc. vs Curtiss-Wright Corporation
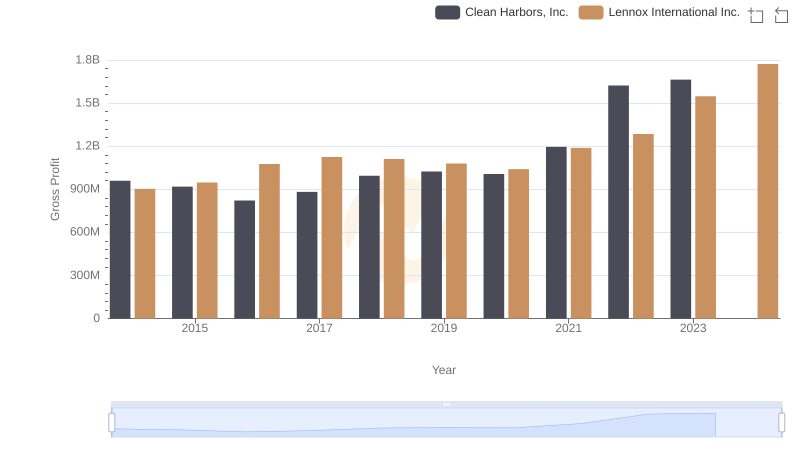
Gross Profit Trends Compared: Lennox International Inc. vs Clean Harbors, Inc.
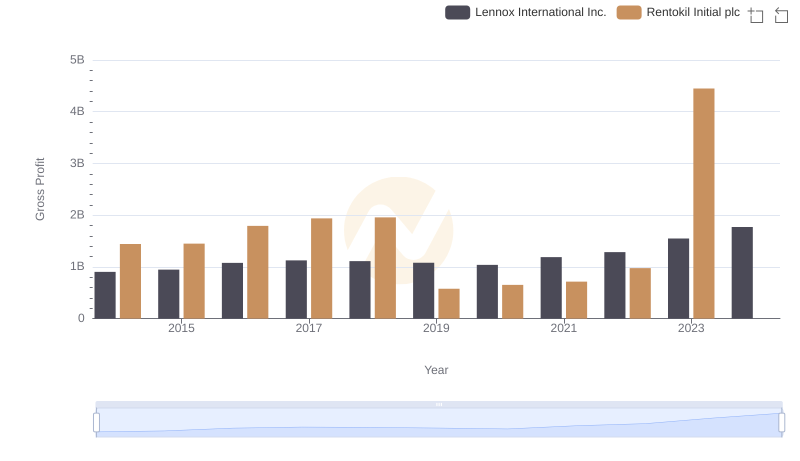
Gross Profit Comparison: Lennox International Inc. and Rentokil Initial plc Trends
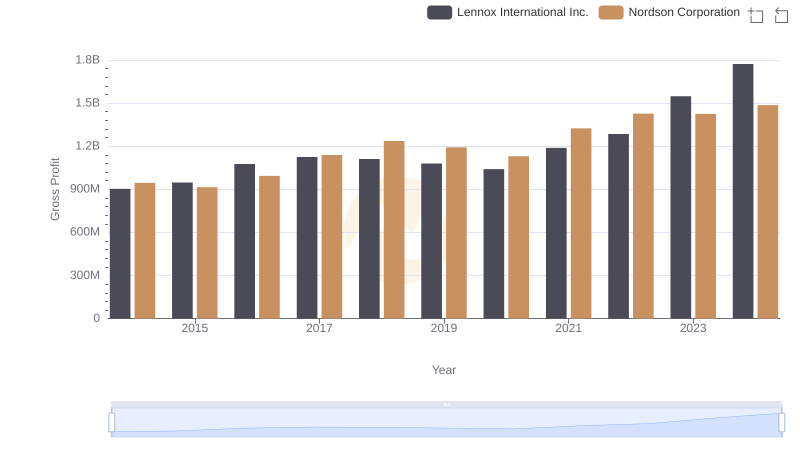
Gross Profit Trends Compared: Lennox International Inc. vs Nordson Corporation
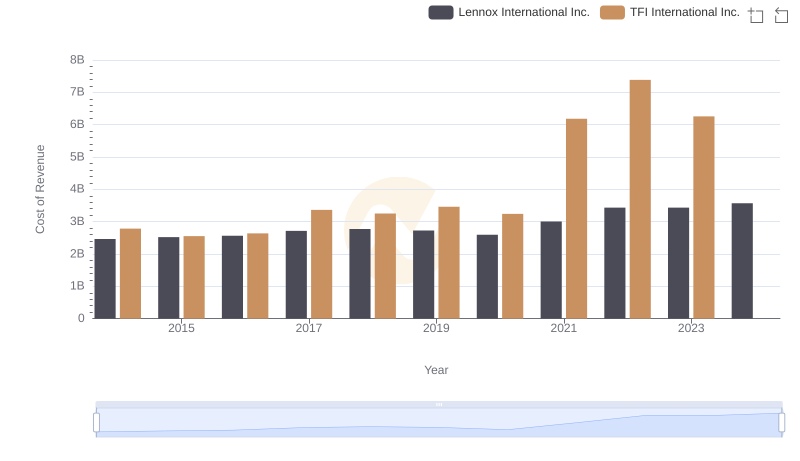
Cost of Revenue Trends: Lennox International Inc. vs TFI International Inc.
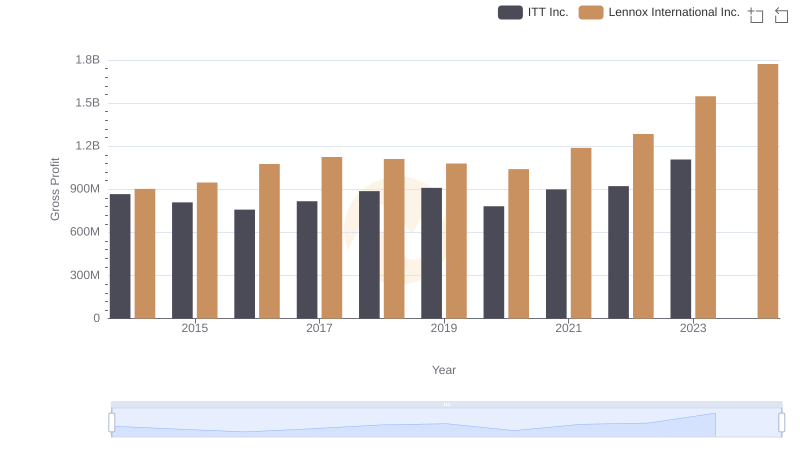
Gross Profit Trends Compared: Lennox International Inc. vs ITT Inc.
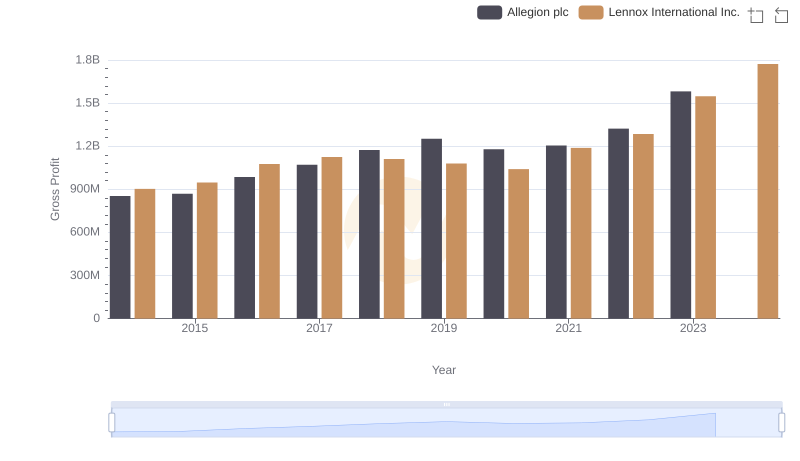
Key Insights on Gross Profit: Lennox International Inc. vs Allegion plc
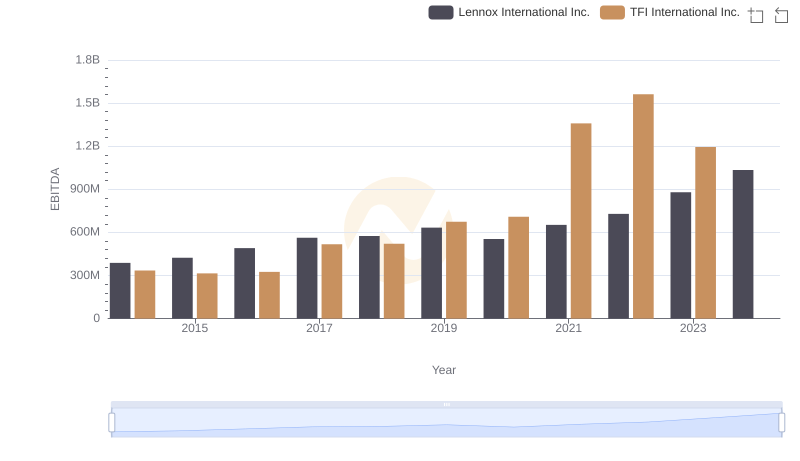
A Professional Review of EBITDA: Lennox International Inc. Compared to TFI International Inc.