| __timestamp | Clean Harbors, Inc. | Lennox International Inc. |
|---|---|---|
| Wednesday, January 1, 2014 | 2441796000 | 2464100000 |
| Thursday, January 1, 2015 | 2356806000 | 2520000000 |
| Friday, January 1, 2016 | 1932857000 | 2565100000 |
| Sunday, January 1, 2017 | 2062673000 | 2714400000 |
| Monday, January 1, 2018 | 2305551000 | 2772700000 |
| Tuesday, January 1, 2019 | 2387819000 | 2727400000 |
| Wednesday, January 1, 2020 | 2137751000 | 2594000000 |
| Friday, January 1, 2021 | 2609837000 | 3005700000 |
| Saturday, January 1, 2022 | 3543930000 | 3433700000 |
| Sunday, January 1, 2023 | 3746124000 | 3434100000 |
| Monday, January 1, 2024 | 4065713000 | 3569400000 |
Data in motion
In the ever-evolving landscape of industrial services and manufacturing, Lennox International Inc. and Clean Harbors, Inc. stand as titans. Over the past decade, these companies have showcased distinct trajectories in their cost of revenue. From 2014 to 2023, Lennox International Inc. consistently maintained a higher cost of revenue, peaking at approximately $3.57 billion in 2024. This represents a 45% increase from their 2014 figures. Meanwhile, Clean Harbors, Inc. experienced a significant surge, with a 54% rise from 2014 to 2023, reaching nearly $3.75 billion. This growth reflects their strategic expansions and operational efficiencies. Notably, 2022 marked a pivotal year for both, with Clean Harbors surpassing Lennox for the first time. As we look to the future, these trends offer insights into the competitive dynamics and financial strategies shaping the industrial sector.
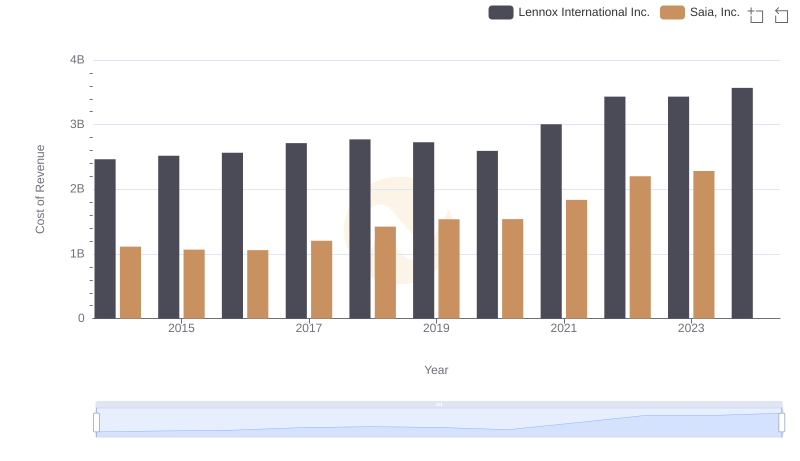
Cost Insights: Breaking Down Lennox International Inc. and Saia, Inc.'s Expenses
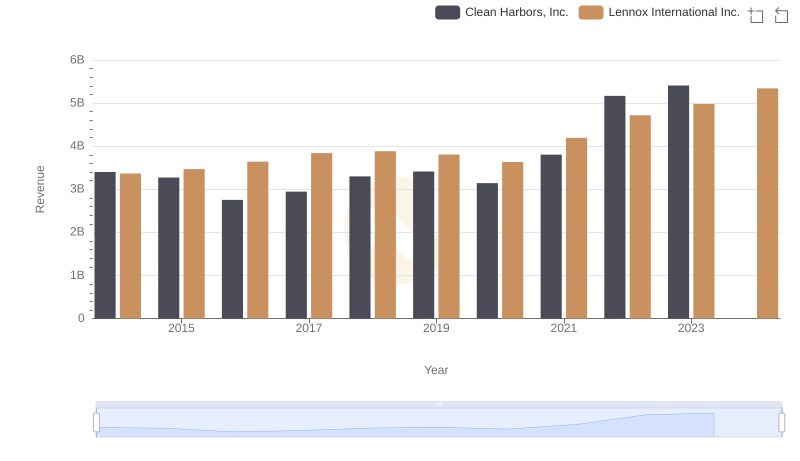
Comparing Revenue Performance: Lennox International Inc. or Clean Harbors, Inc.?
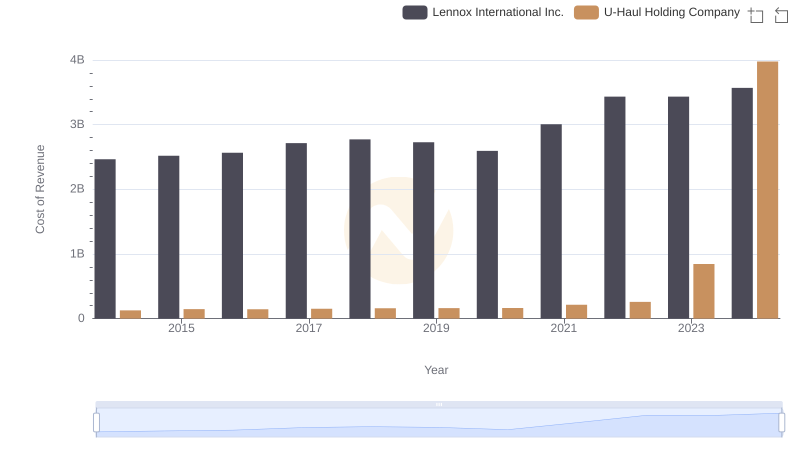
Cost Insights: Breaking Down Lennox International Inc. and U-Haul Holding Company's Expenses
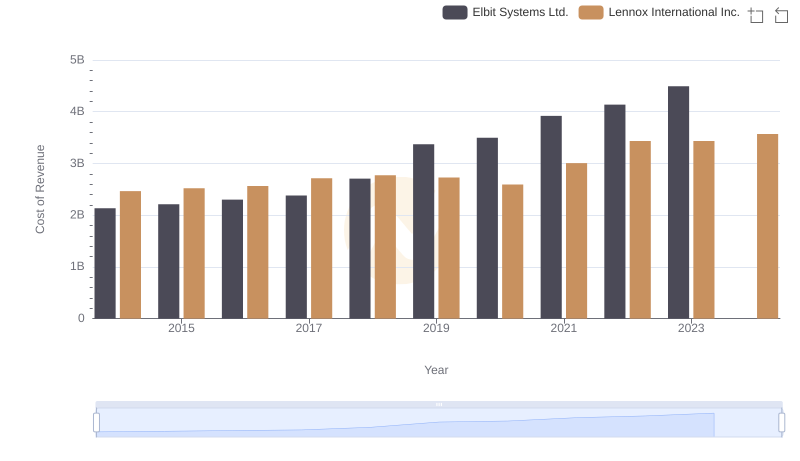
Cost of Revenue: Key Insights for Lennox International Inc. and Elbit Systems Ltd.
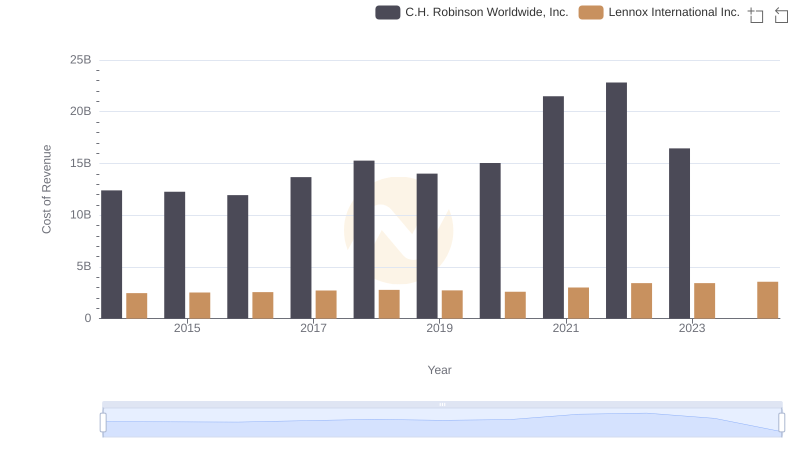
Cost of Revenue: Key Insights for Lennox International Inc. and C.H. Robinson Worldwide, Inc.
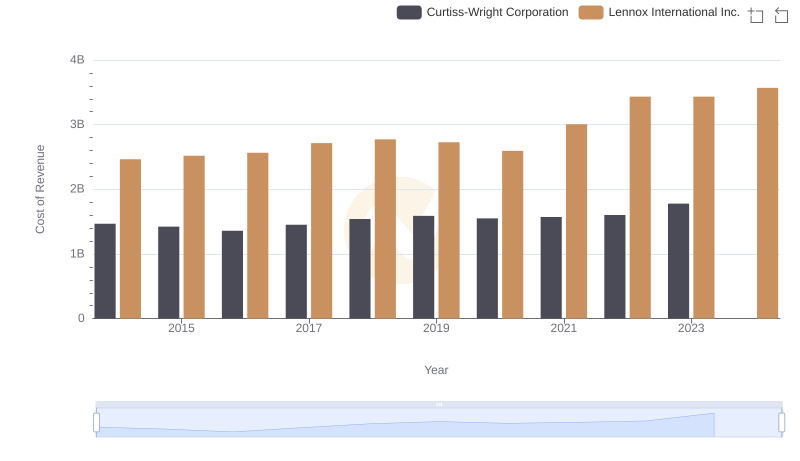
Cost of Revenue Comparison: Lennox International Inc. vs Curtiss-Wright Corporation
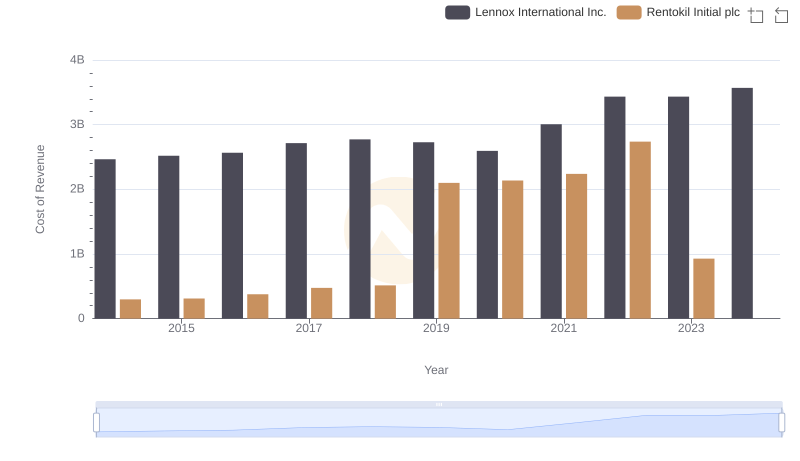
Cost Insights: Breaking Down Lennox International Inc. and Rentokil Initial plc's Expenses
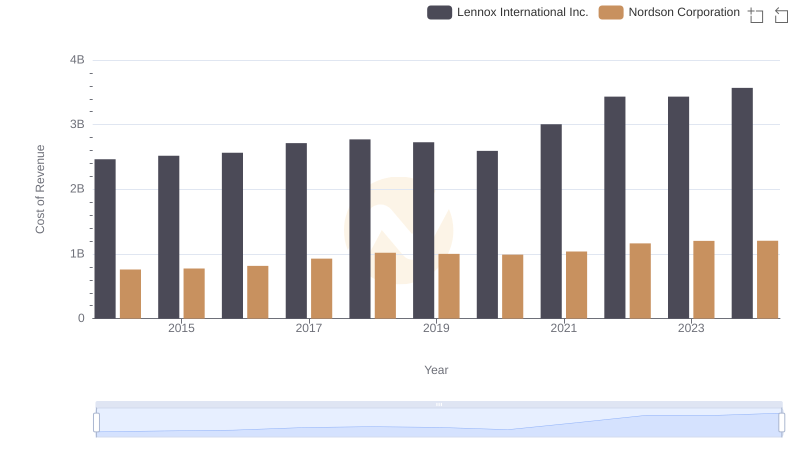
Cost of Revenue: Key Insights for Lennox International Inc. and Nordson Corporation
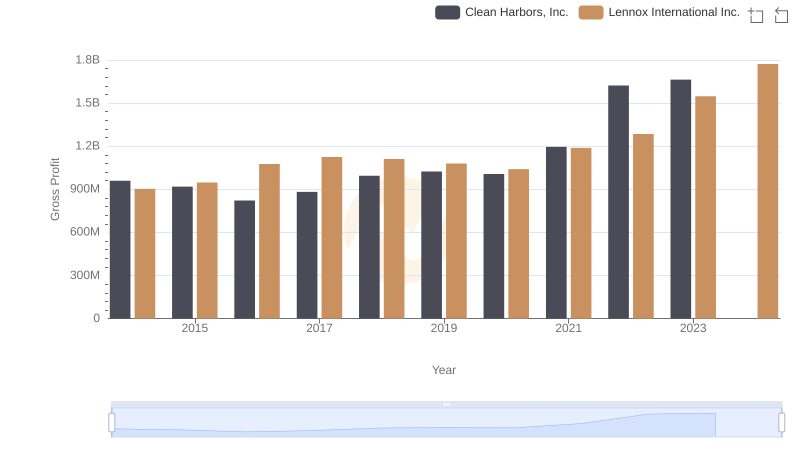
Gross Profit Trends Compared: Lennox International Inc. vs Clean Harbors, Inc.
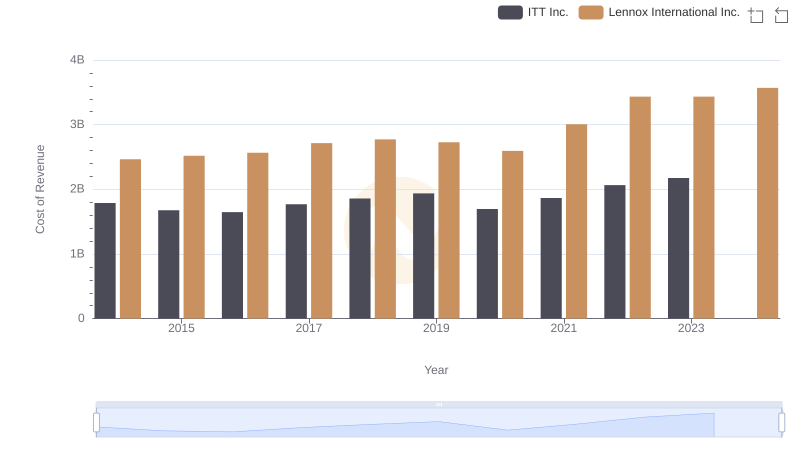
Cost Insights: Breaking Down Lennox International Inc. and ITT Inc.'s Expenses
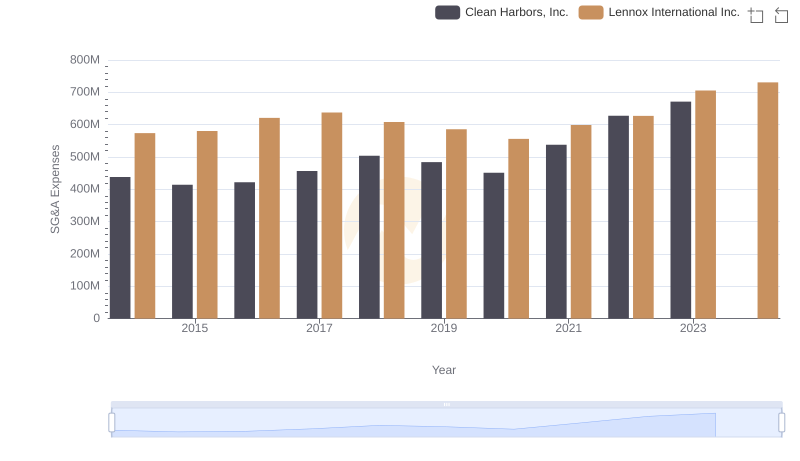
Lennox International Inc. and Clean Harbors, Inc.: SG&A Spending Patterns Compared
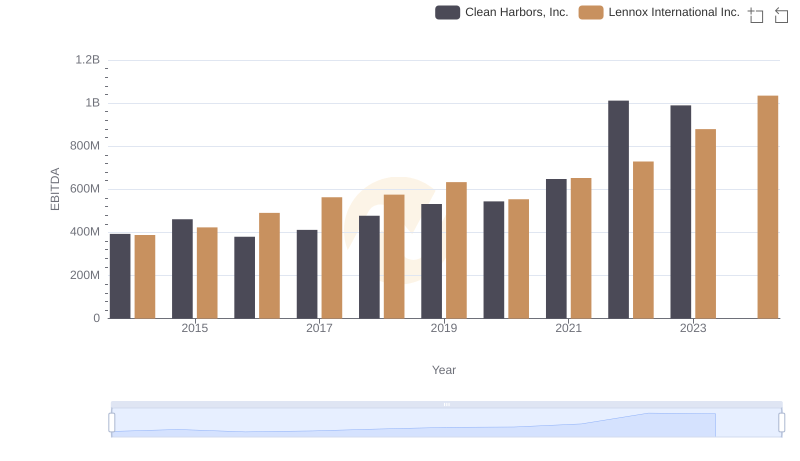
Comparative EBITDA Analysis: Lennox International Inc. vs Clean Harbors, Inc.