| __timestamp | Lennox International Inc. | TFI International Inc. |
|---|---|---|
| Wednesday, January 1, 2014 | 3367400000 | 3199928501 |
| Thursday, January 1, 2015 | 3467400000 | 2904026835 |
| Friday, January 1, 2016 | 3641600000 | 2994723606 |
| Sunday, January 1, 2017 | 3839600000 | 3770194035 |
| Monday, January 1, 2018 | 3883900000 | 3761450188 |
| Tuesday, January 1, 2019 | 3807200000 | 3964619871 |
| Wednesday, January 1, 2020 | 3634100000 | 3781134000 |
| Friday, January 1, 2021 | 4194100000 | 7220429000 |
| Saturday, January 1, 2022 | 4718400000 | 8812491000 |
| Sunday, January 1, 2023 | 4981900000 | 7521167000 |
| Monday, January 1, 2024 | 5341300000 |
Unveiling the hidden dimensions of data
In the ever-evolving landscape of industrial giants, Lennox International Inc. and TFI International Inc. have carved out significant niches. Over the past decade, Lennox has seen a steady revenue growth, with a remarkable 59% increase from 2014 to 2023. Meanwhile, TFI International has experienced a more volatile journey, with revenues peaking in 2022 at nearly 9 billion, a staggering 175% increase from 2014. However, 2023 saw a dip, highlighting the dynamic nature of the logistics industry.
This analysis underscores the resilience and adaptability required to thrive in today's competitive markets.
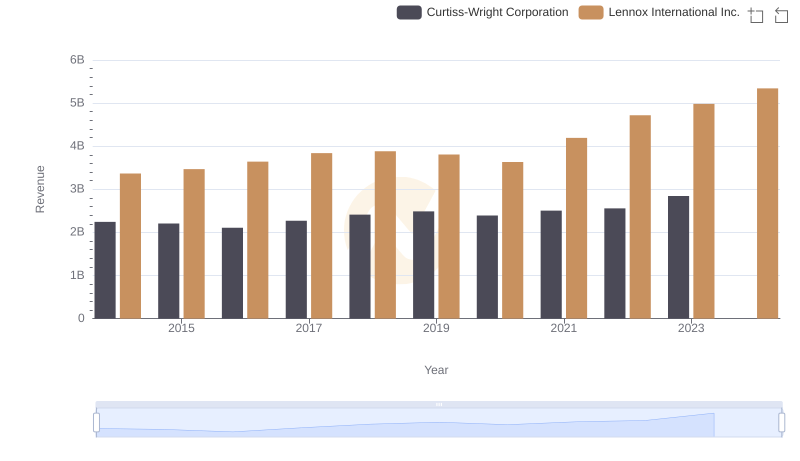
Revenue Showdown: Lennox International Inc. vs Curtiss-Wright Corporation
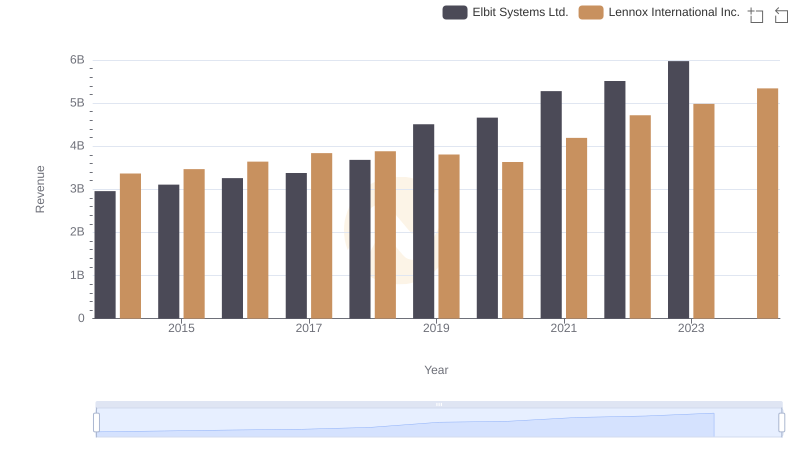
Lennox International Inc. or Elbit Systems Ltd.: Who Leads in Yearly Revenue?
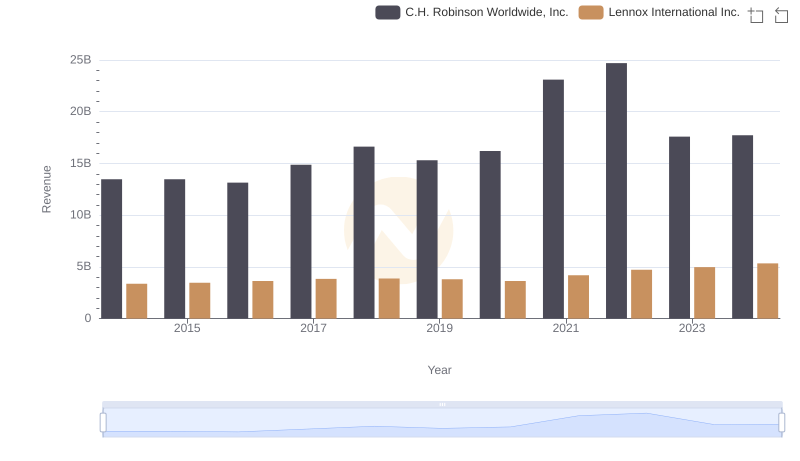
Revenue Showdown: Lennox International Inc. vs C.H. Robinson Worldwide, Inc.
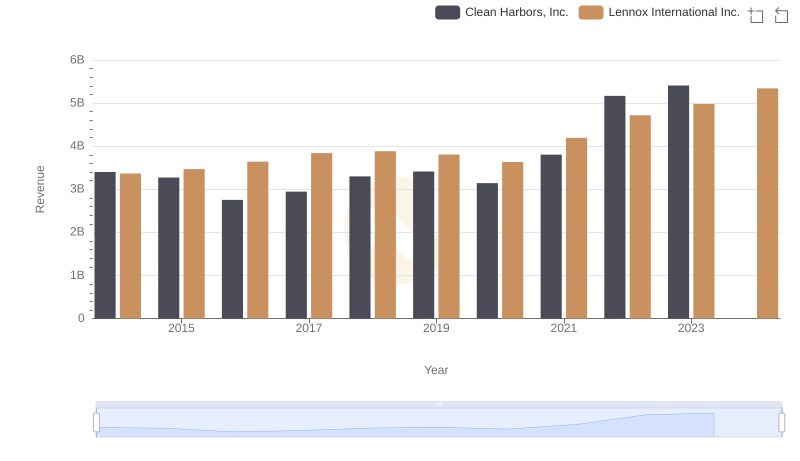
Comparing Revenue Performance: Lennox International Inc. or Clean Harbors, Inc.?
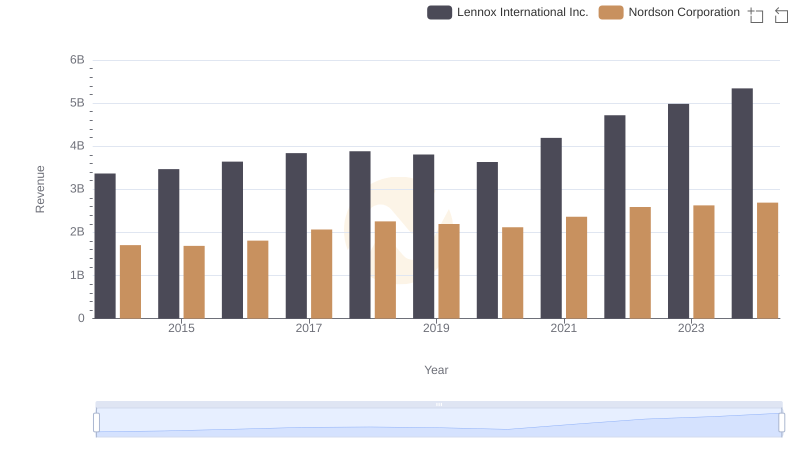
Revenue Showdown: Lennox International Inc. vs Nordson Corporation
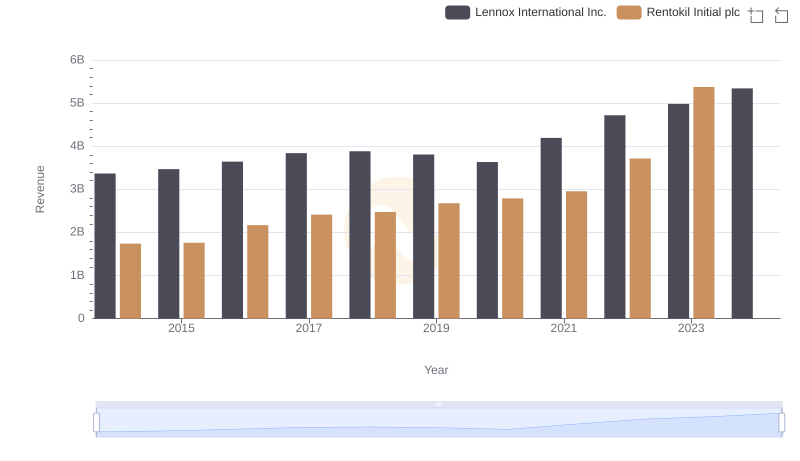
Annual Revenue Comparison: Lennox International Inc. vs Rentokil Initial plc
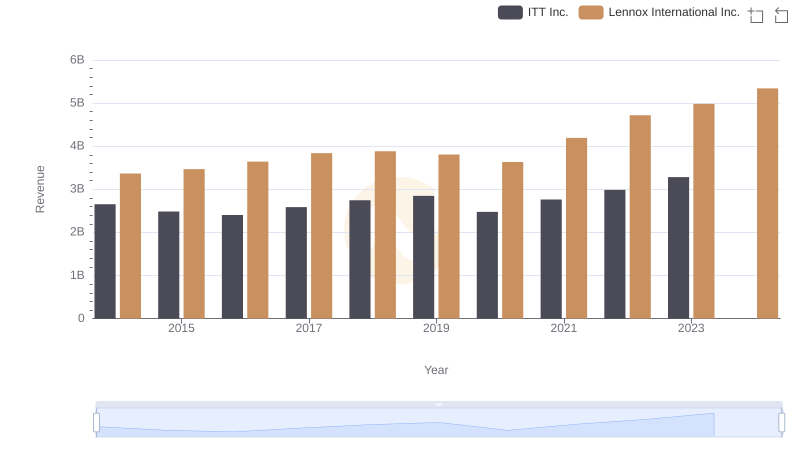
Annual Revenue Comparison: Lennox International Inc. vs ITT Inc.
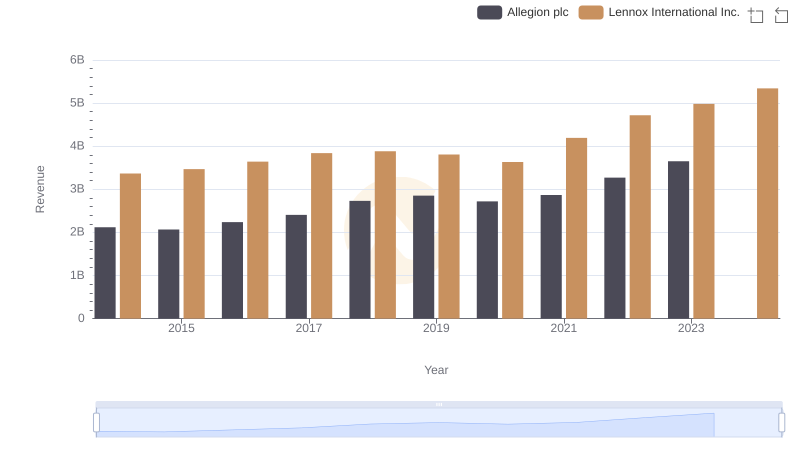
Annual Revenue Comparison: Lennox International Inc. vs Allegion plc
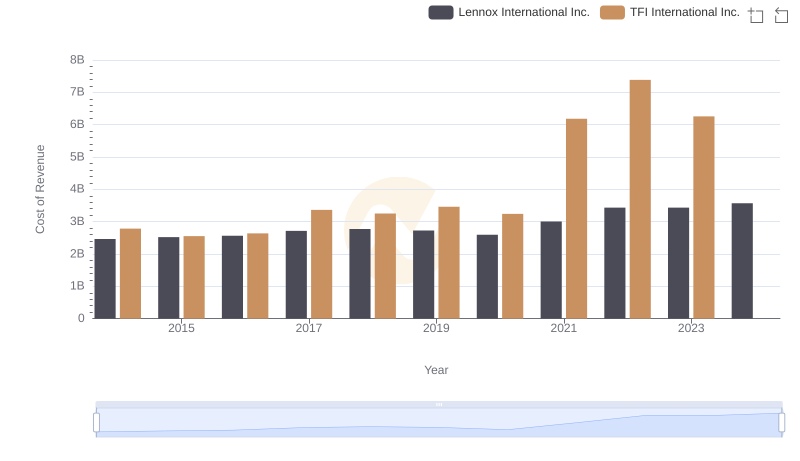
Cost of Revenue Trends: Lennox International Inc. vs TFI International Inc.
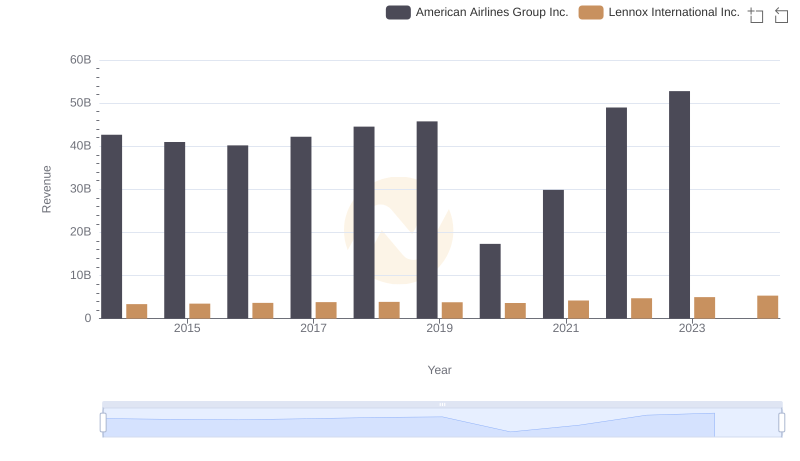
Revenue Showdown: Lennox International Inc. vs American Airlines Group Inc.
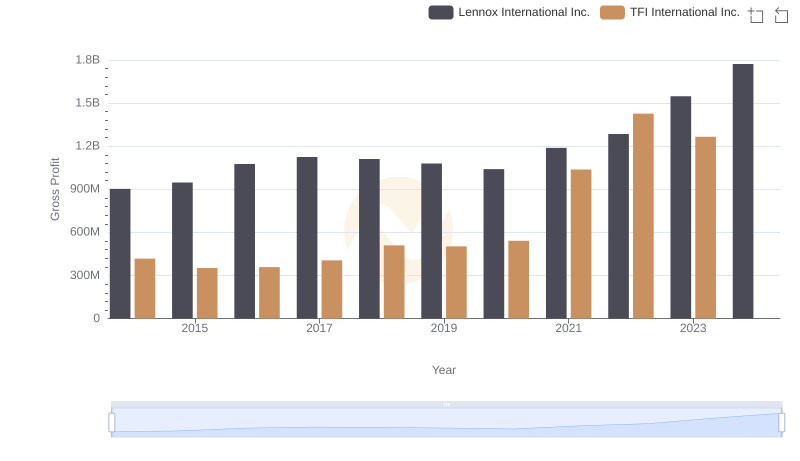
Gross Profit Analysis: Comparing Lennox International Inc. and TFI International Inc.
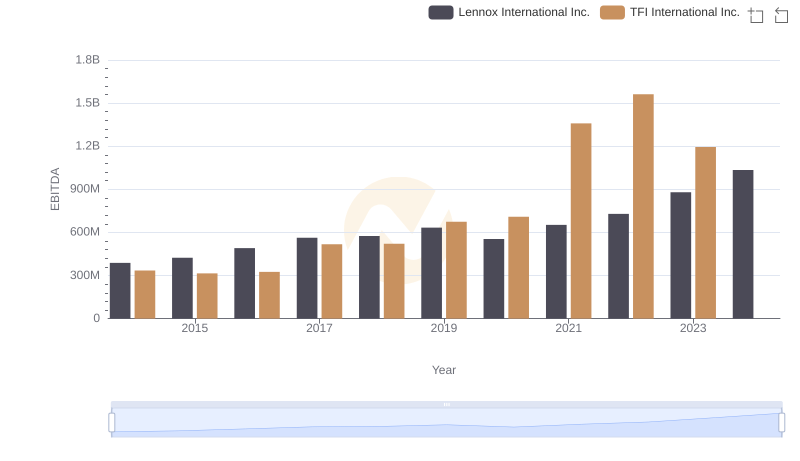
A Professional Review of EBITDA: Lennox International Inc. Compared to TFI International Inc.