| __timestamp | ITT Inc. | Lennox International Inc. |
|---|---|---|
| Wednesday, January 1, 2014 | 1788200000 | 2464100000 |
| Thursday, January 1, 2015 | 1676500000 | 2520000000 |
| Friday, January 1, 2016 | 1647200000 | 2565100000 |
| Sunday, January 1, 2017 | 1768100000 | 2714400000 |
| Monday, January 1, 2018 | 1857900000 | 2772700000 |
| Tuesday, January 1, 2019 | 1936300000 | 2727400000 |
| Wednesday, January 1, 2020 | 1695600000 | 2594000000 |
| Friday, January 1, 2021 | 1865500000 | 3005700000 |
| Saturday, January 1, 2022 | 2065400000 | 3433700000 |
| Sunday, January 1, 2023 | 2175700000 | 3434100000 |
| Monday, January 1, 2024 | 2383400000 | 3569400000 |
Unlocking the unknown
In the ever-evolving landscape of industrial manufacturing, understanding cost dynamics is crucial. Lennox International Inc. and ITT Inc., two giants in the sector, have shown distinct trends in their cost of revenue over the past decade. From 2014 to 2023, Lennox International Inc. has seen a steady increase in its cost of revenue, peaking at approximately $3.43 billion in 2023, a 39% rise from 2014. In contrast, ITT Inc. experienced a more modest growth, with a 22% increase over the same period, reaching around $2.18 billion in 2023. Notably, Lennox's costs surged significantly in 2021, marking a 16% jump from the previous year. These insights highlight the differing strategies and market conditions faced by these companies. As we look to 2024, Lennox's data continues, while ITT's remains elusive, leaving room for speculation on future trends.
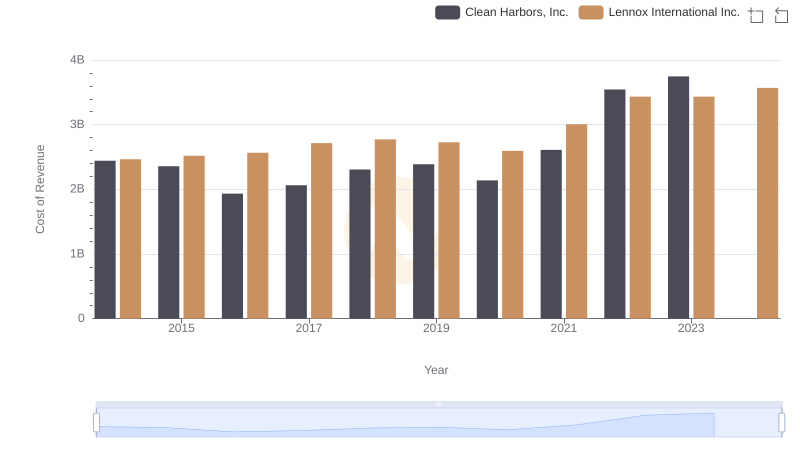
Cost of Revenue Comparison: Lennox International Inc. vs Clean Harbors, Inc.
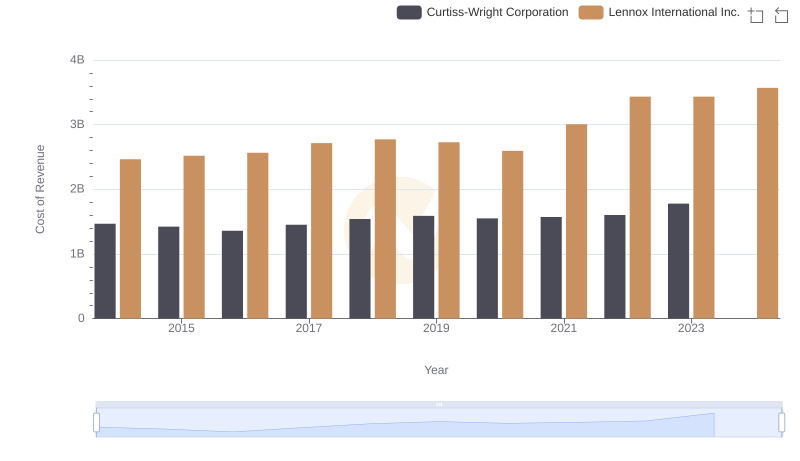
Cost of Revenue Comparison: Lennox International Inc. vs Curtiss-Wright Corporation
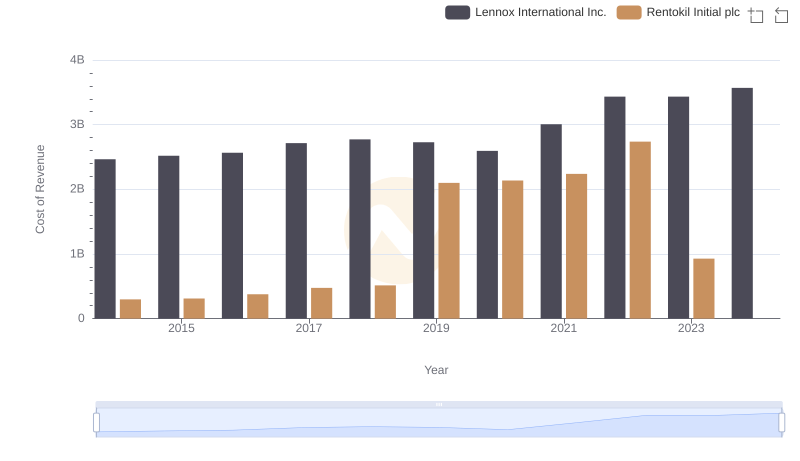
Cost Insights: Breaking Down Lennox International Inc. and Rentokil Initial plc's Expenses
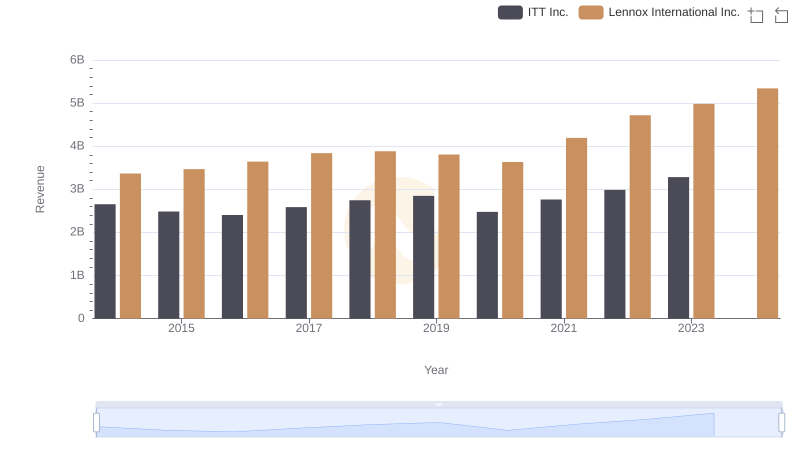
Annual Revenue Comparison: Lennox International Inc. vs ITT Inc.
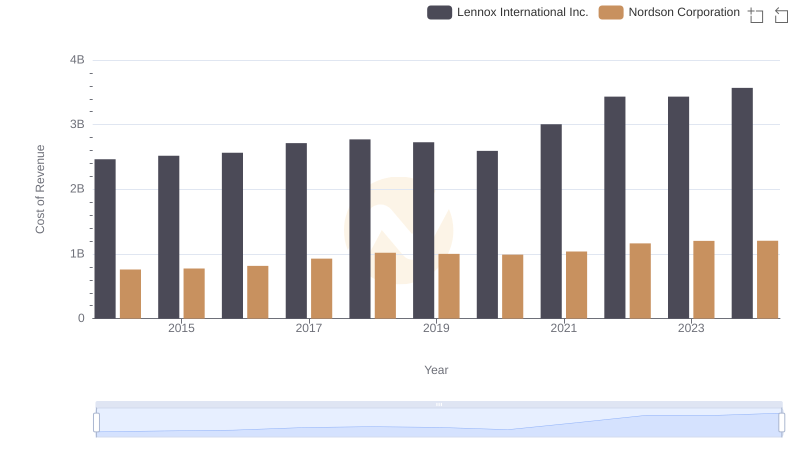
Cost of Revenue: Key Insights for Lennox International Inc. and Nordson Corporation
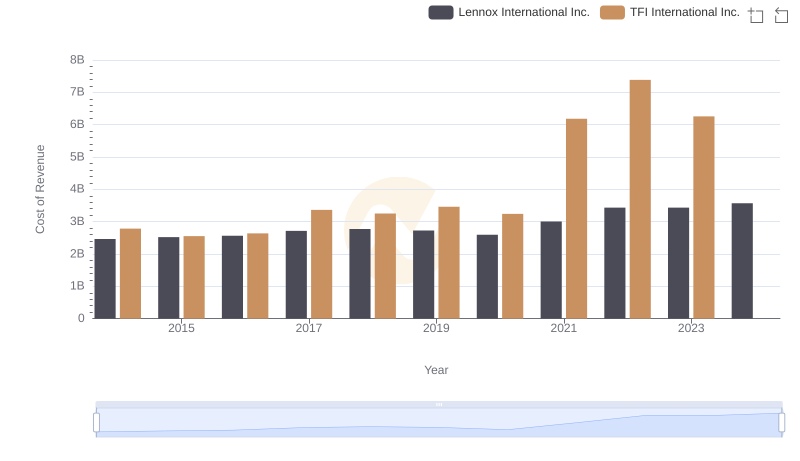
Cost of Revenue Trends: Lennox International Inc. vs TFI International Inc.
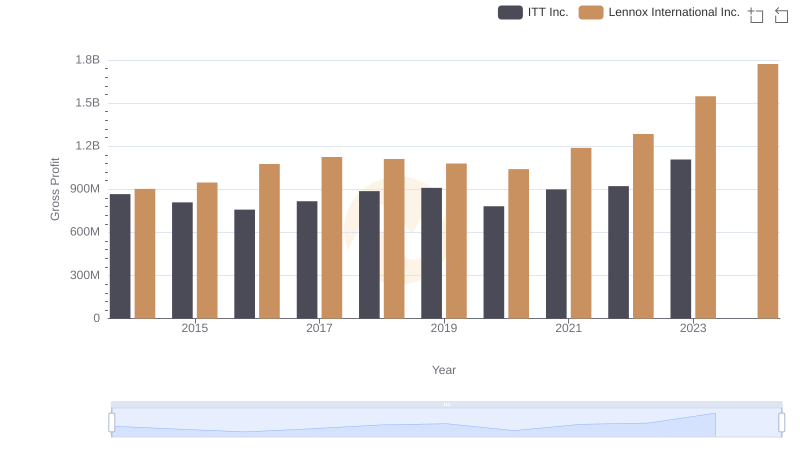
Gross Profit Trends Compared: Lennox International Inc. vs ITT Inc.
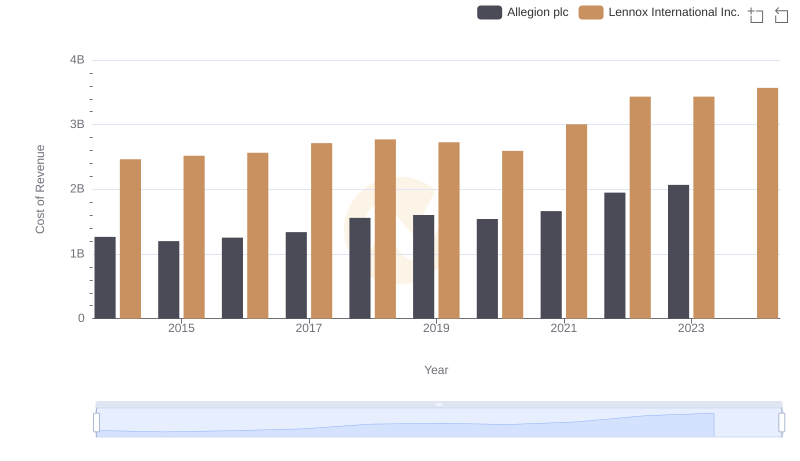
Analyzing Cost of Revenue: Lennox International Inc. and Allegion plc
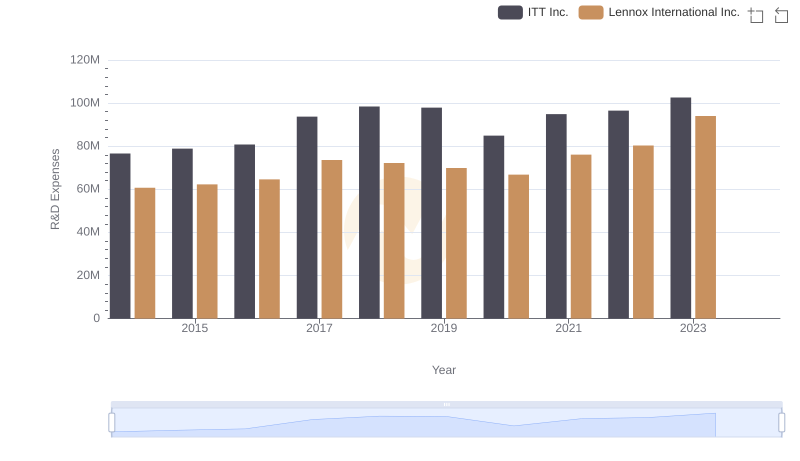
Lennox International Inc. or ITT Inc.: Who Invests More in Innovation?
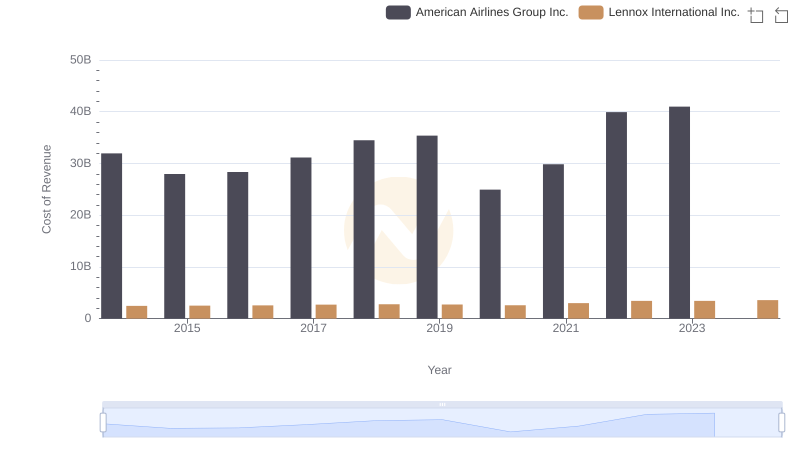
Comparing Cost of Revenue Efficiency: Lennox International Inc. vs American Airlines Group Inc.
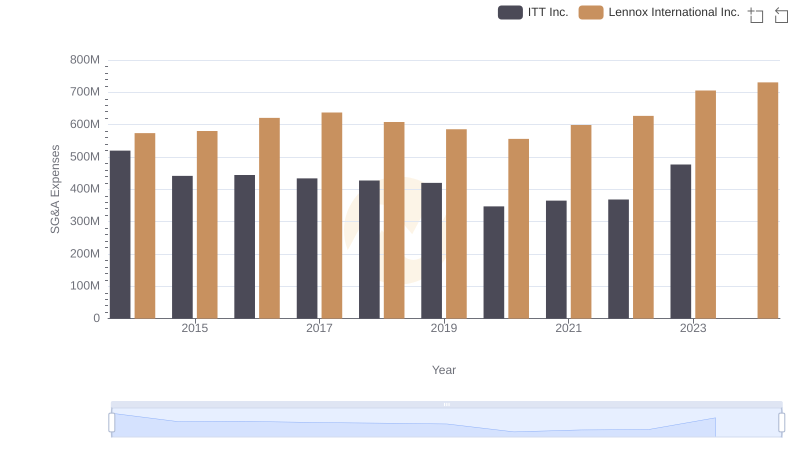
Who Optimizes SG&A Costs Better? Lennox International Inc. or ITT Inc.
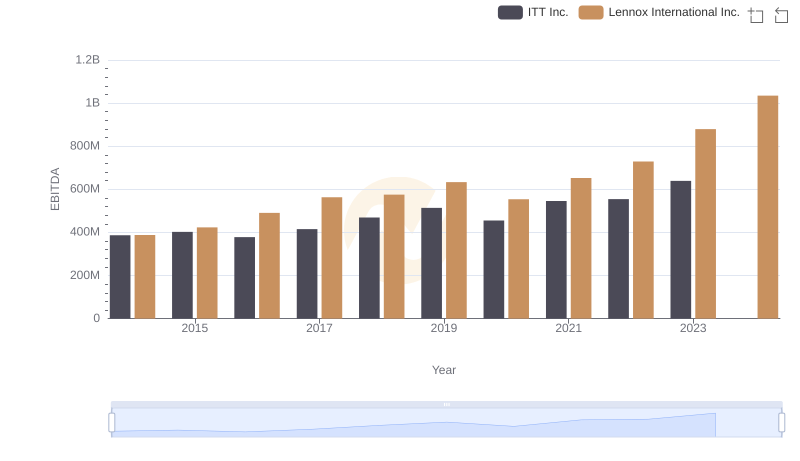
Comprehensive EBITDA Comparison: Lennox International Inc. vs ITT Inc.