| __timestamp | Lennox International Inc. | TFI International Inc. |
|---|---|---|
| Wednesday, January 1, 2014 | 387700000 | 334908602 |
| Thursday, January 1, 2015 | 423600000 | 314924803 |
| Friday, January 1, 2016 | 490800000 | 325584405 |
| Sunday, January 1, 2017 | 562900000 | 517899005 |
| Monday, January 1, 2018 | 575200000 | 521265317 |
| Tuesday, January 1, 2019 | 633300000 | 674440000 |
| Wednesday, January 1, 2020 | 553900000 | 709296000 |
| Friday, January 1, 2021 | 652500000 | 1358717000 |
| Saturday, January 1, 2022 | 729000000 | 1561728000 |
| Sunday, January 1, 2023 | 879500000 | 1194213000 |
| Monday, January 1, 2024 | 1034800000 |
Unleashing the power of data
In the ever-evolving landscape of industrial giants, Lennox International Inc. and TFI International Inc. have showcased remarkable EBITDA growth over the past decade. From 2014 to 2023, Lennox International's EBITDA surged by approximately 167%, reflecting its robust operational efficiency and strategic market positioning. Meanwhile, TFI International demonstrated an even more impressive trajectory, with its EBITDA increasing by nearly 257% during the same period, underscoring its aggressive expansion and acquisition strategies.
The year 2021 marked a pivotal point for TFI International, as its EBITDA soared to over double that of Lennox International, highlighting its dominance in the logistics sector. However, by 2023, Lennox International narrowed the gap, achieving a 20% increase from the previous year, while TFI International experienced a slight decline. This dynamic interplay between the two companies offers a fascinating glimpse into their competitive strategies and market adaptability.
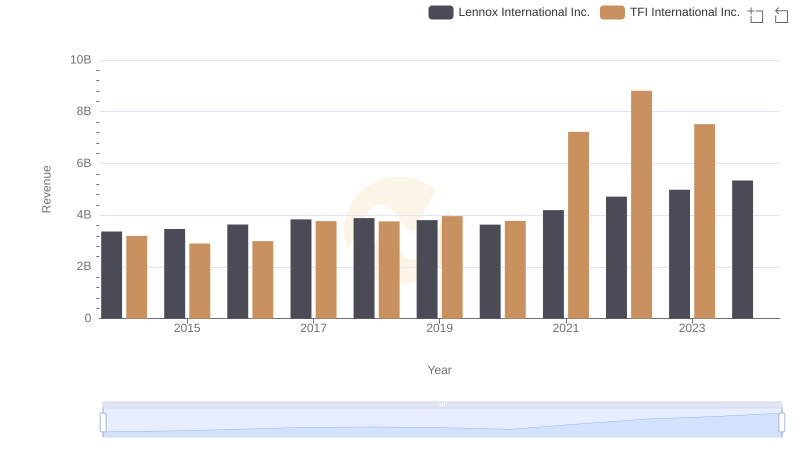
Lennox International Inc. and TFI International Inc.: A Comprehensive Revenue Analysis
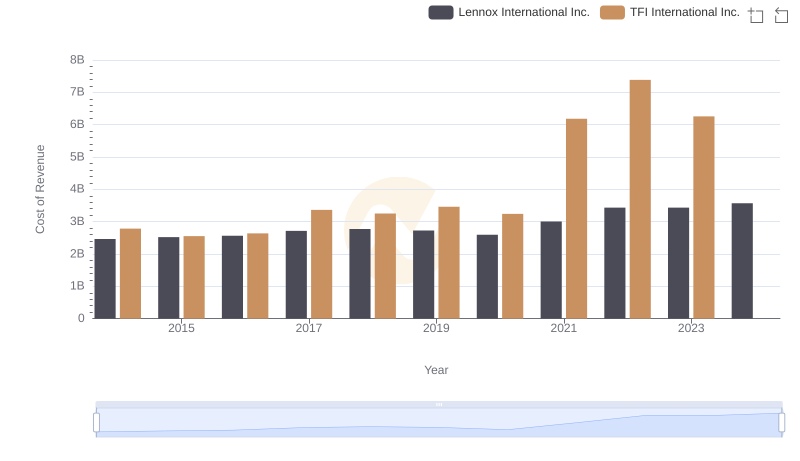
Cost of Revenue Trends: Lennox International Inc. vs TFI International Inc.
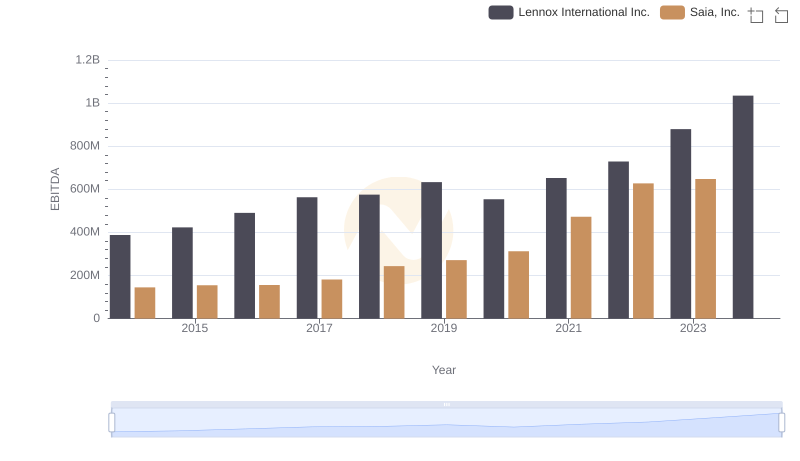
Comprehensive EBITDA Comparison: Lennox International Inc. vs Saia, Inc.
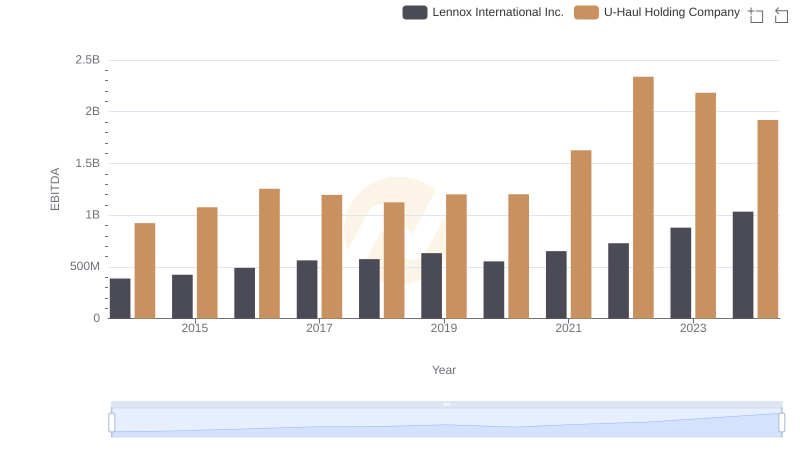
A Professional Review of EBITDA: Lennox International Inc. Compared to U-Haul Holding Company
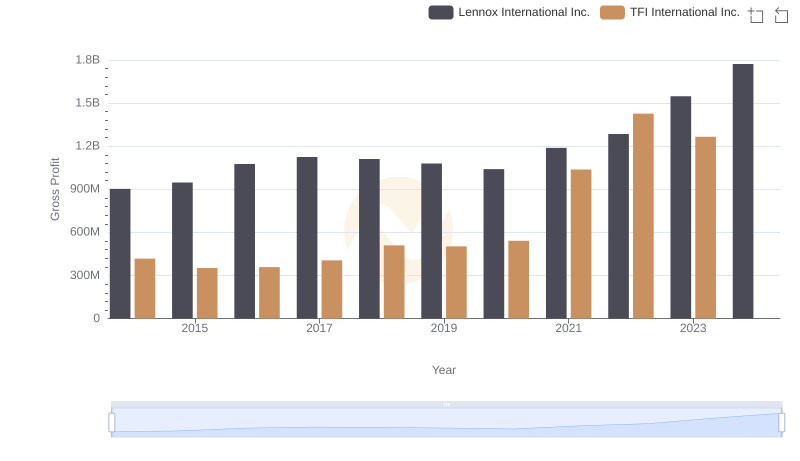
Gross Profit Analysis: Comparing Lennox International Inc. and TFI International Inc.
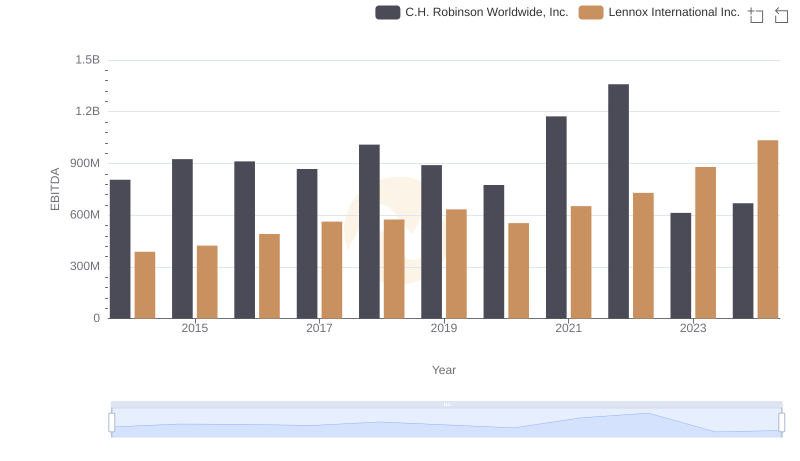
A Professional Review of EBITDA: Lennox International Inc. Compared to C.H. Robinson Worldwide, Inc.
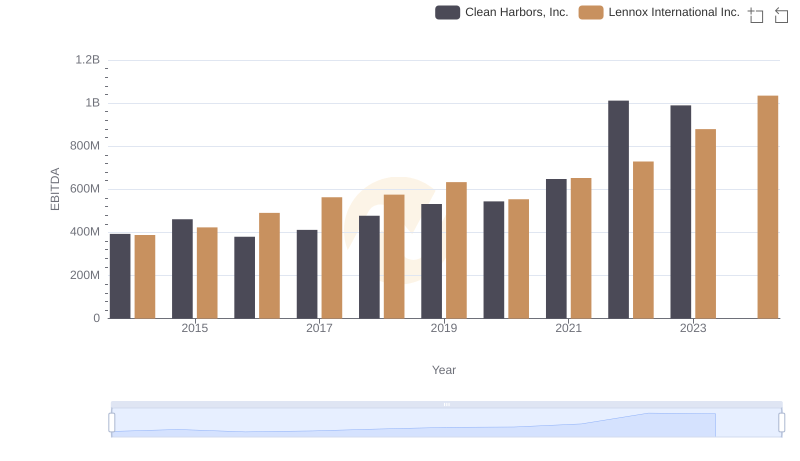
Comparative EBITDA Analysis: Lennox International Inc. vs Clean Harbors, Inc.
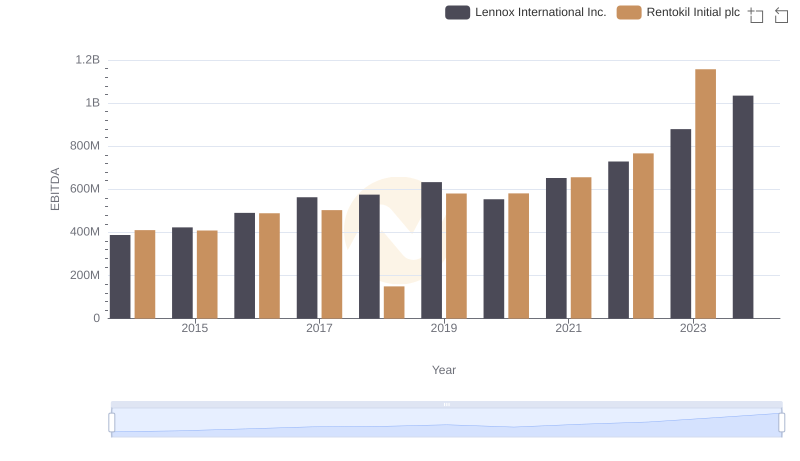
Lennox International Inc. vs Rentokil Initial plc: In-Depth EBITDA Performance Comparison
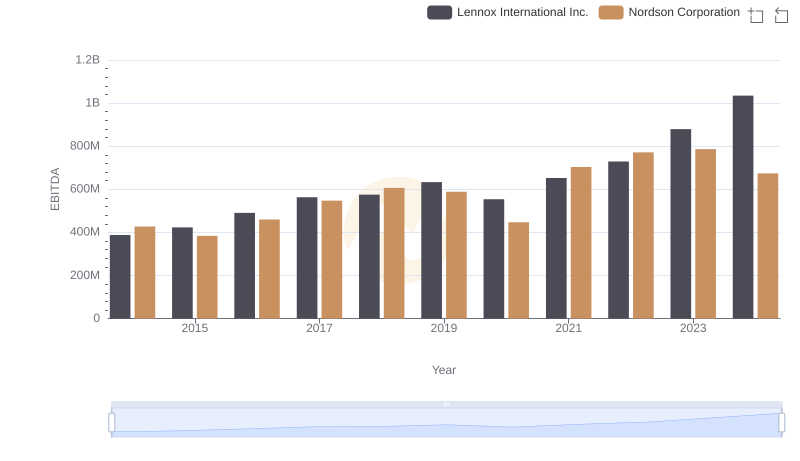
Lennox International Inc. vs Nordson Corporation: In-Depth EBITDA Performance Comparison

Professional EBITDA Benchmarking: Lennox International Inc. vs Curtiss-Wright Corporation
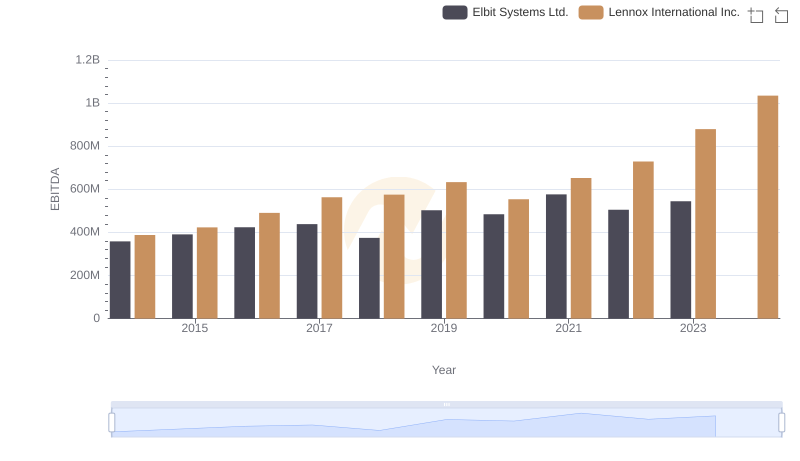
Professional EBITDA Benchmarking: Lennox International Inc. vs Elbit Systems Ltd.
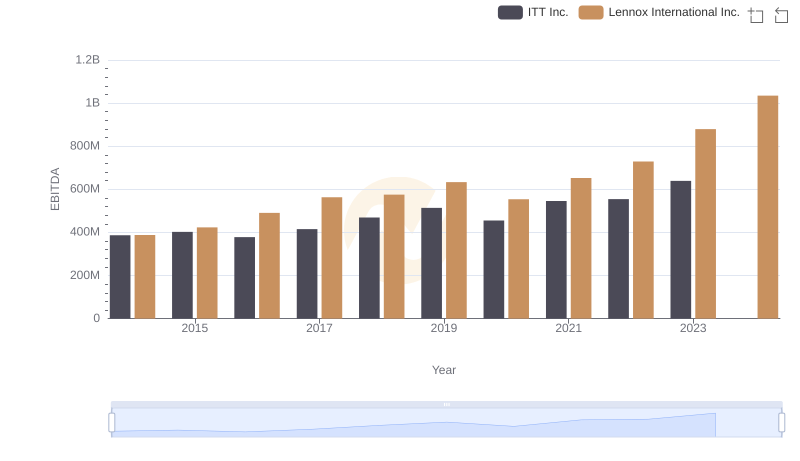
Comprehensive EBITDA Comparison: Lennox International Inc. vs ITT Inc.