| __timestamp | C.H. Robinson Worldwide, Inc. | Lennox International Inc. |
|---|---|---|
| Wednesday, January 1, 2014 | 12401436000 | 2464100000 |
| Thursday, January 1, 2015 | 12259014000 | 2520000000 |
| Friday, January 1, 2016 | 11931821000 | 2565100000 |
| Sunday, January 1, 2017 | 13680857000 | 2714400000 |
| Monday, January 1, 2018 | 15269479000 | 2772700000 |
| Tuesday, January 1, 2019 | 14021726000 | 2727400000 |
| Wednesday, January 1, 2020 | 15037716000 | 2594000000 |
| Friday, January 1, 2021 | 21493659000 | 3005700000 |
| Saturday, January 1, 2022 | 22826428000 | 3433700000 |
| Sunday, January 1, 2023 | 16457570000 | 3434100000 |
| Monday, January 1, 2024 | 16416191000 | 3569400000 |
Igniting the spark of knowledge
In the ever-evolving landscape of American industry, understanding the cost of revenue is crucial for evaluating a company's financial health. From 2014 to 2023, C.H. Robinson Worldwide, Inc. and Lennox International Inc. have shown distinct trajectories in their cost of revenue.
C.H. Robinson, a leader in logistics, saw a significant 84% increase in cost of revenue from 2014 to 2022, peaking in 2022 before a notable decline in 2023. This fluctuation reflects the dynamic nature of global supply chains. Meanwhile, Lennox International, a key player in climate control solutions, experienced a steady 39% rise over the same period, indicating consistent growth and operational efficiency.
These insights highlight the contrasting strategies and market conditions faced by these industry giants, offering valuable lessons for investors and analysts alike.
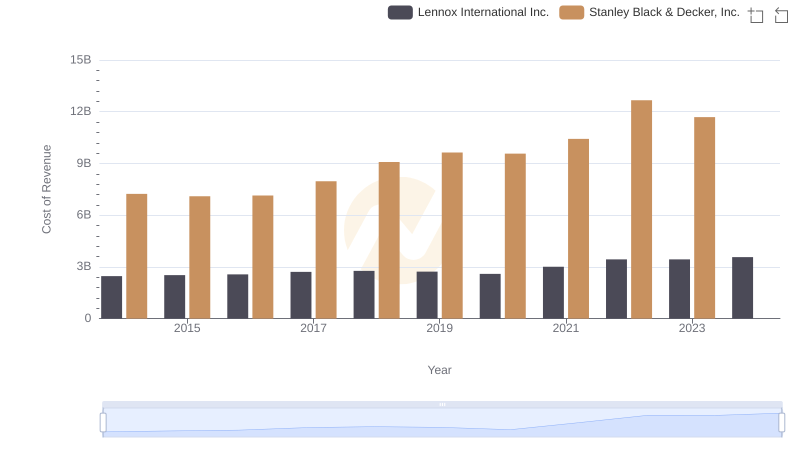
Analyzing Cost of Revenue: Lennox International Inc. and Stanley Black & Decker, Inc.
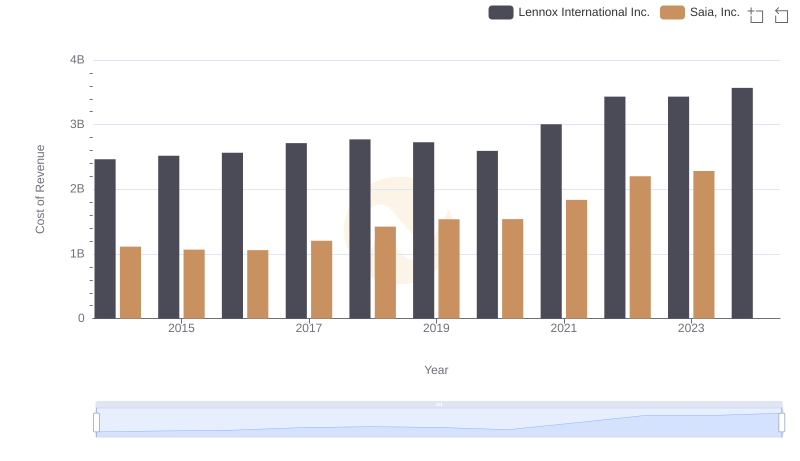
Cost Insights: Breaking Down Lennox International Inc. and Saia, Inc.'s Expenses
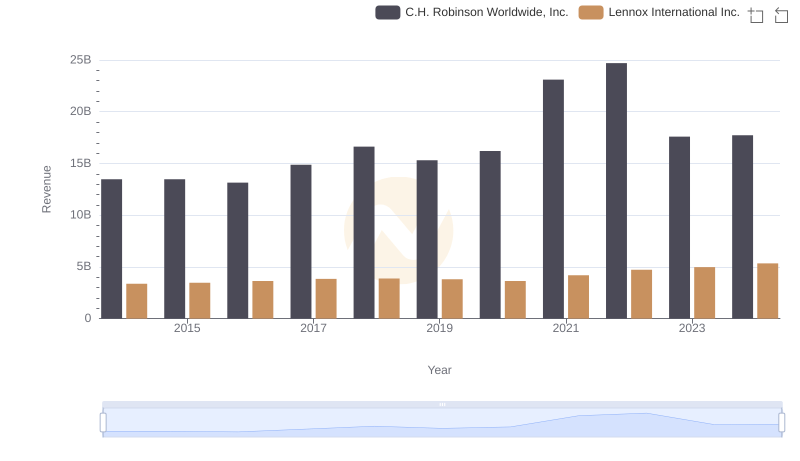
Revenue Showdown: Lennox International Inc. vs C.H. Robinson Worldwide, Inc.
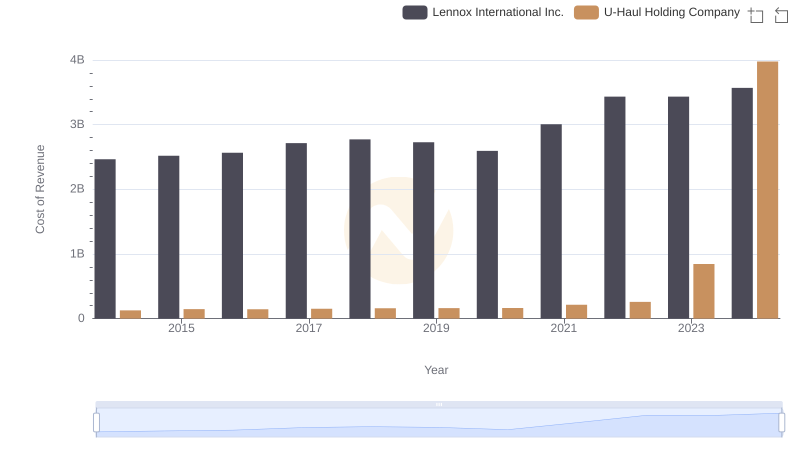
Cost Insights: Breaking Down Lennox International Inc. and U-Haul Holding Company's Expenses
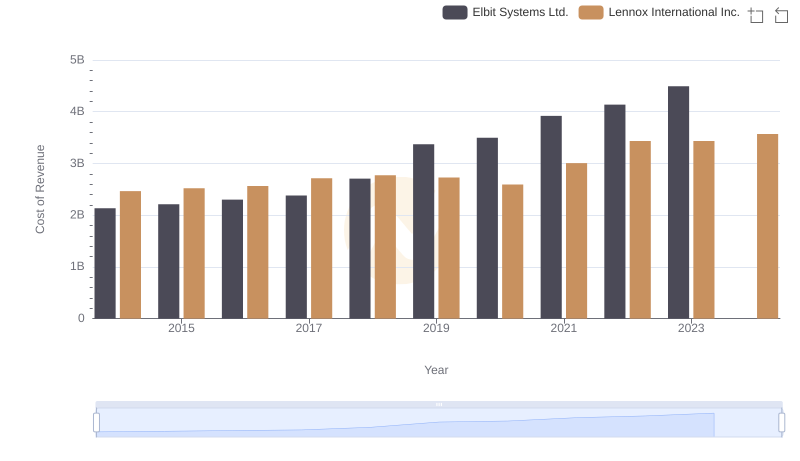
Cost of Revenue: Key Insights for Lennox International Inc. and Elbit Systems Ltd.
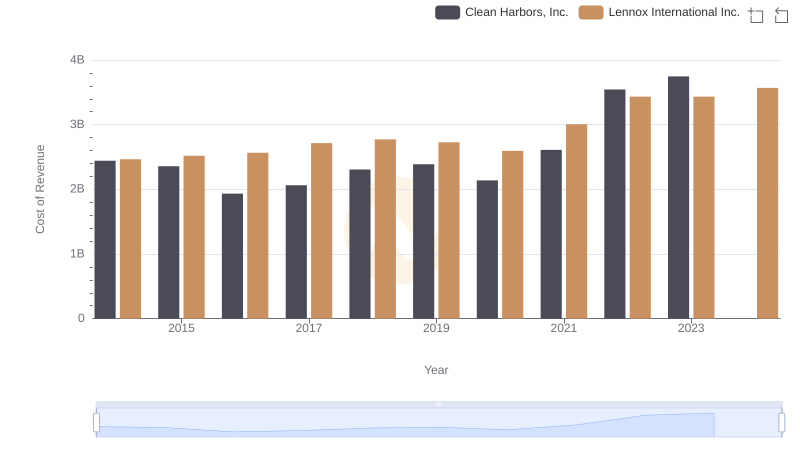
Cost of Revenue Comparison: Lennox International Inc. vs Clean Harbors, Inc.
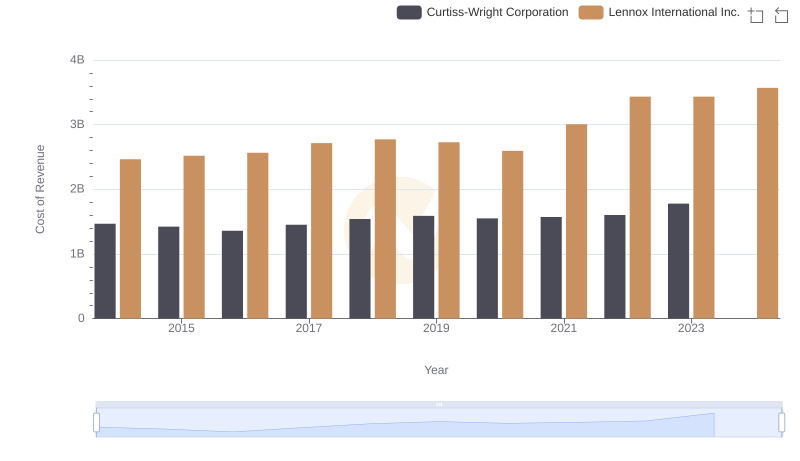
Cost of Revenue Comparison: Lennox International Inc. vs Curtiss-Wright Corporation
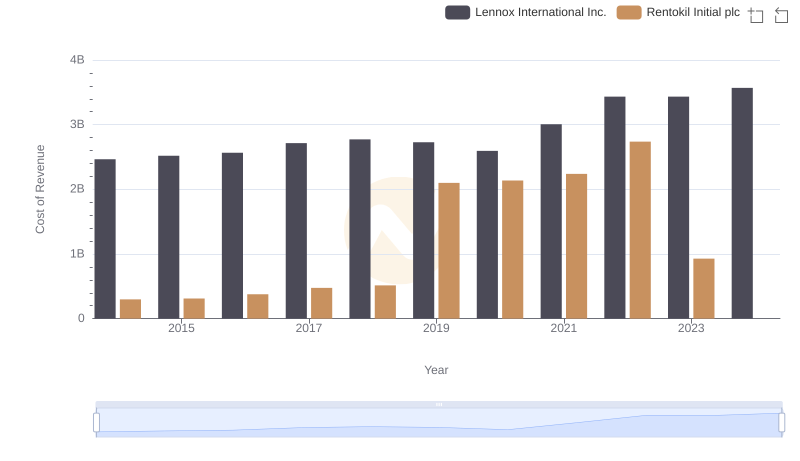
Cost Insights: Breaking Down Lennox International Inc. and Rentokil Initial plc's Expenses
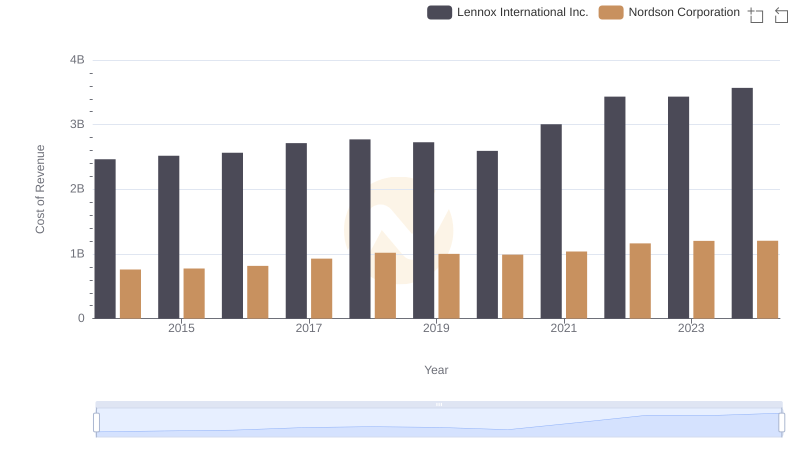
Cost of Revenue: Key Insights for Lennox International Inc. and Nordson Corporation
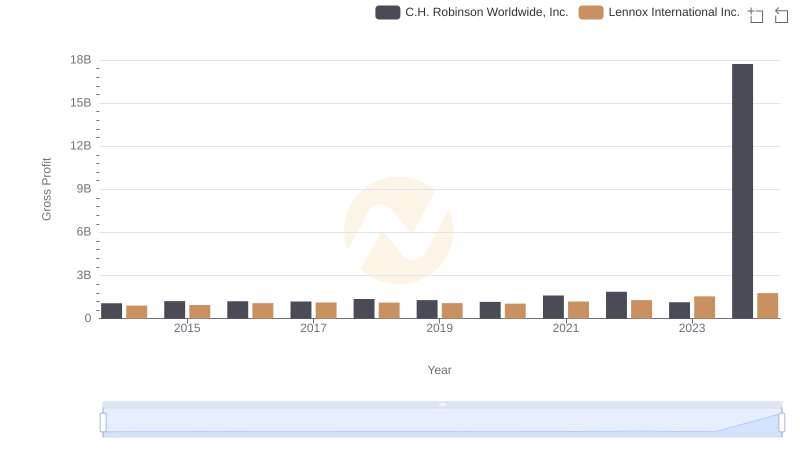
Gross Profit Analysis: Comparing Lennox International Inc. and C.H. Robinson Worldwide, Inc.
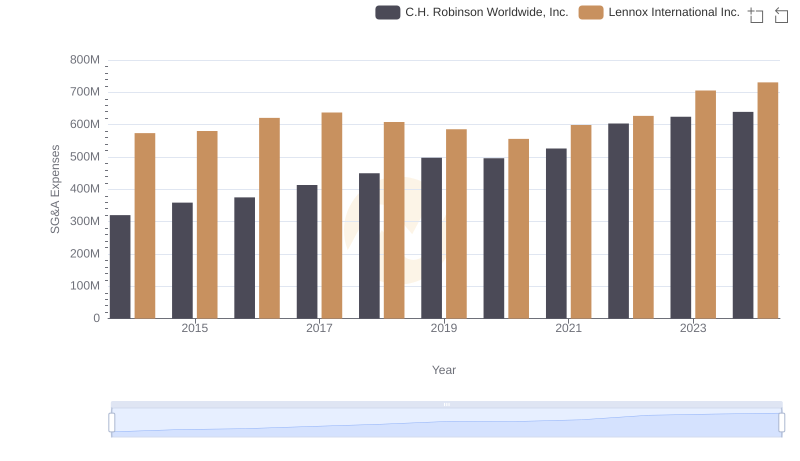
Comparing SG&A Expenses: Lennox International Inc. vs C.H. Robinson Worldwide, Inc. Trends and Insights
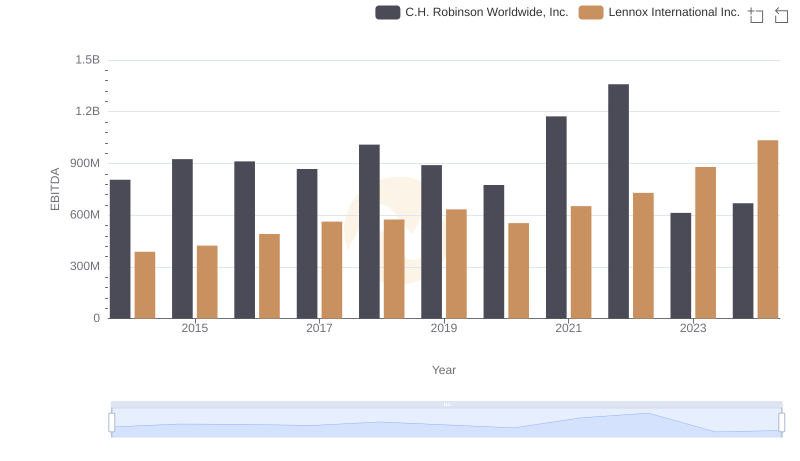
A Professional Review of EBITDA: Lennox International Inc. Compared to C.H. Robinson Worldwide, Inc.