| __timestamp | Lennox International Inc. | Nordson Corporation |
|---|---|---|
| Wednesday, January 1, 2014 | 2464100000 | 758923000 |
| Thursday, January 1, 2015 | 2520000000 | 774702000 |
| Friday, January 1, 2016 | 2565100000 | 815495000 |
| Sunday, January 1, 2017 | 2714400000 | 927981000 |
| Monday, January 1, 2018 | 2772700000 | 1018703000 |
| Tuesday, January 1, 2019 | 2727400000 | 1002123000 |
| Wednesday, January 1, 2020 | 2594000000 | 990632000 |
| Friday, January 1, 2021 | 3005700000 | 1038129000 |
| Saturday, January 1, 2022 | 3433700000 | 1163742000 |
| Sunday, January 1, 2023 | 3434100000 | 1203227000 |
| Monday, January 1, 2024 | 3569400000 | 1203792000 |
Unveiling the hidden dimensions of data
In the competitive landscape of industrial manufacturing, understanding cost dynamics is crucial. From 2014 to 2024, Lennox International Inc. and Nordson Corporation have shown distinct trends in their cost of revenue. Lennox International Inc. has seen a steady increase, with costs rising approximately 45% over the decade, peaking in 2024. This growth reflects strategic investments and scaling operations. Meanwhile, Nordson Corporation's cost of revenue has grown by about 59%, indicating robust expansion and possibly increased production efficiency. Notably, both companies experienced a dip in 2020, likely due to global economic disruptions. By 2024, Lennox's costs are nearly three times that of Nordson, highlighting their larger operational scale. These insights provide a window into the financial strategies and market positioning of these industrial giants.
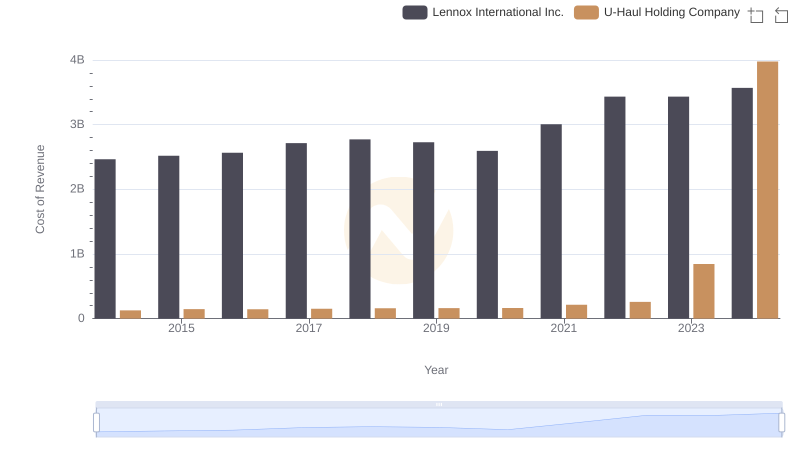
Cost Insights: Breaking Down Lennox International Inc. and U-Haul Holding Company's Expenses
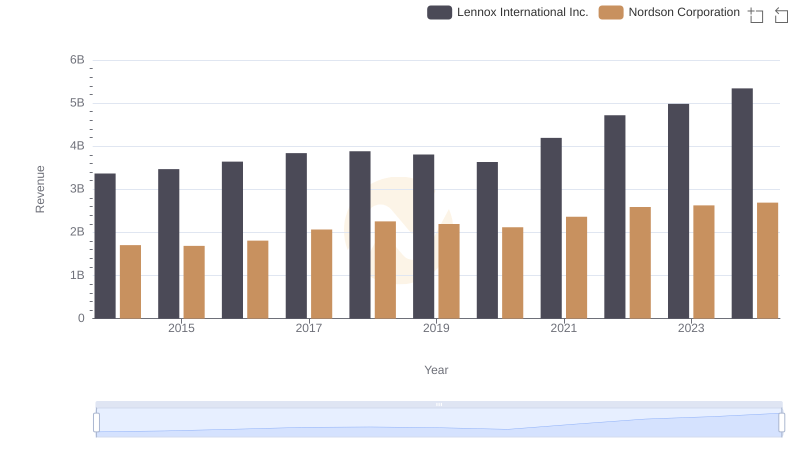
Revenue Showdown: Lennox International Inc. vs Nordson Corporation
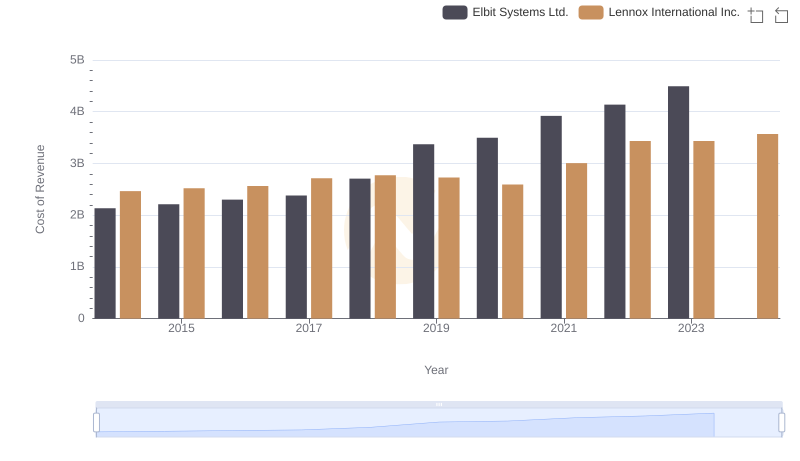
Cost of Revenue: Key Insights for Lennox International Inc. and Elbit Systems Ltd.
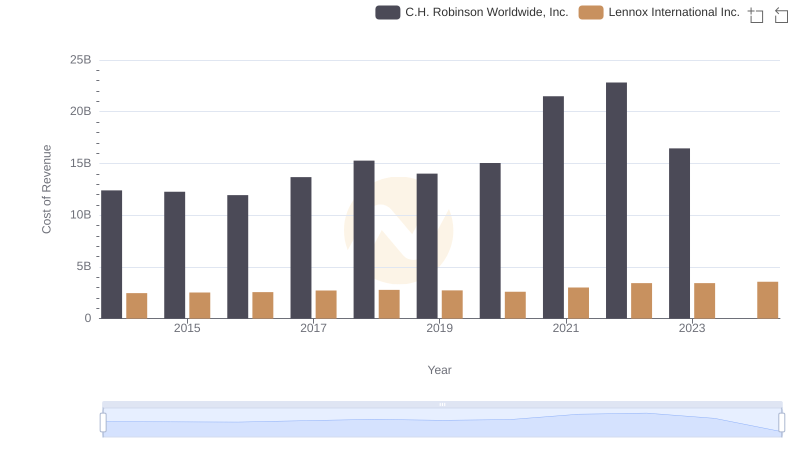
Cost of Revenue: Key Insights for Lennox International Inc. and C.H. Robinson Worldwide, Inc.
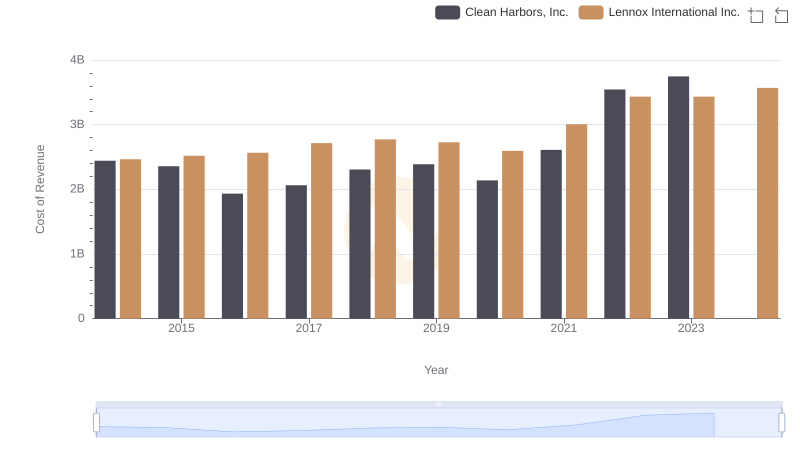
Cost of Revenue Comparison: Lennox International Inc. vs Clean Harbors, Inc.
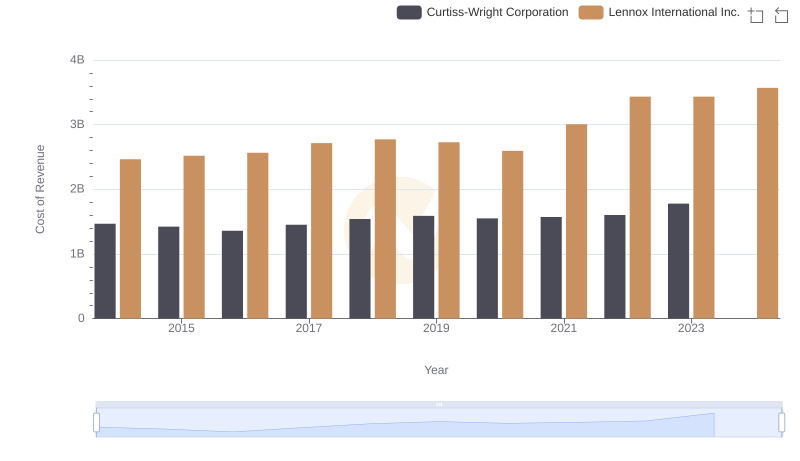
Cost of Revenue Comparison: Lennox International Inc. vs Curtiss-Wright Corporation
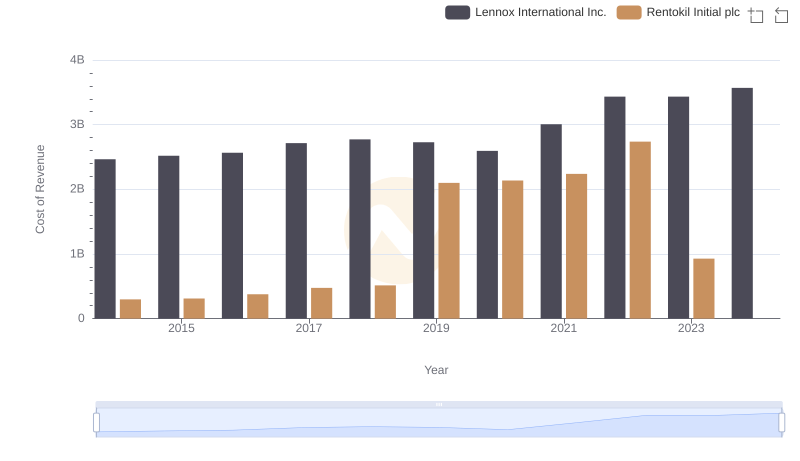
Cost Insights: Breaking Down Lennox International Inc. and Rentokil Initial plc's Expenses
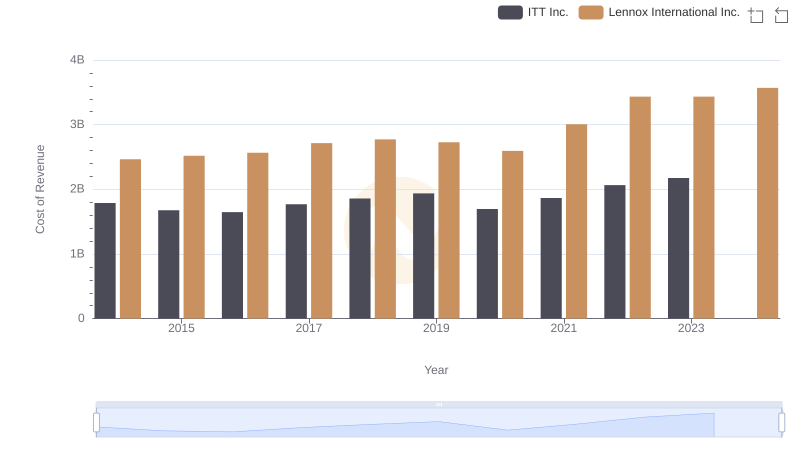
Cost Insights: Breaking Down Lennox International Inc. and ITT Inc.'s Expenses
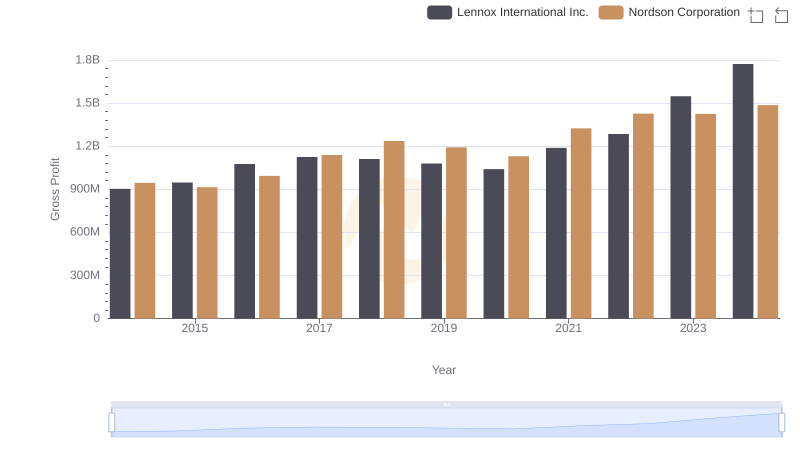
Gross Profit Trends Compared: Lennox International Inc. vs Nordson Corporation
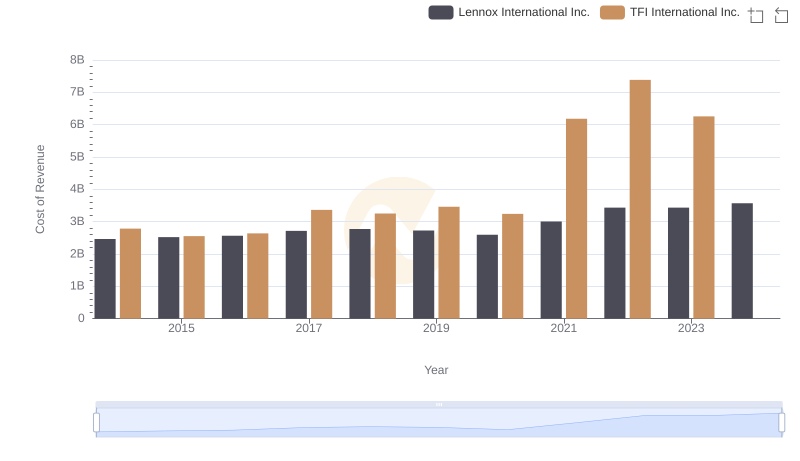
Cost of Revenue Trends: Lennox International Inc. vs TFI International Inc.
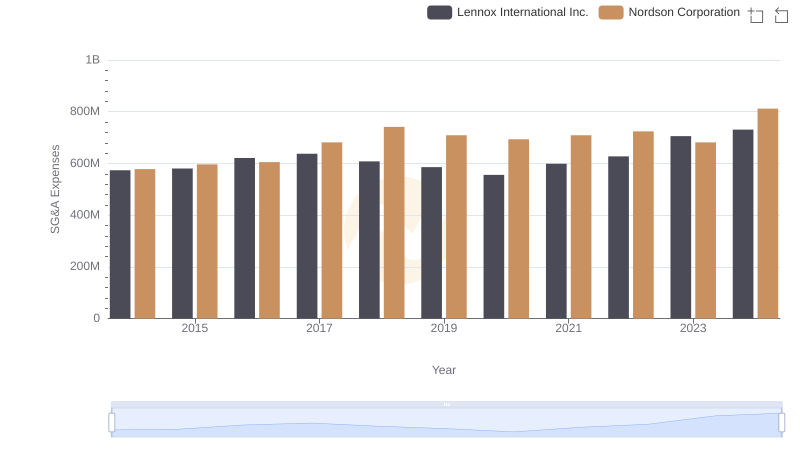
Breaking Down SG&A Expenses: Lennox International Inc. vs Nordson Corporation
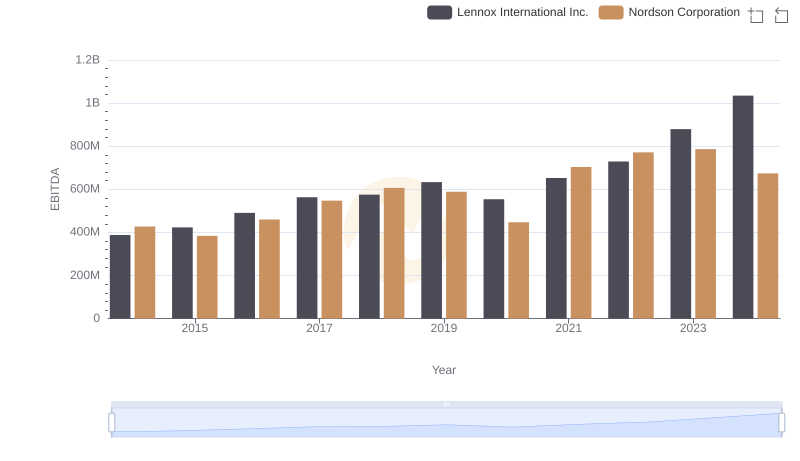
Lennox International Inc. vs Nordson Corporation: In-Depth EBITDA Performance Comparison