| __timestamp | Allegion plc | Lennox International Inc. |
|---|---|---|
| Wednesday, January 1, 2014 | 1264600000 | 2464100000 |
| Thursday, January 1, 2015 | 1199000000 | 2520000000 |
| Friday, January 1, 2016 | 1252700000 | 2565100000 |
| Sunday, January 1, 2017 | 1337500000 | 2714400000 |
| Monday, January 1, 2018 | 1558400000 | 2772700000 |
| Tuesday, January 1, 2019 | 1601700000 | 2727400000 |
| Wednesday, January 1, 2020 | 1541100000 | 2594000000 |
| Friday, January 1, 2021 | 1662500000 | 3005700000 |
| Saturday, January 1, 2022 | 1949500000 | 3433700000 |
| Sunday, January 1, 2023 | 2069300000 | 3434100000 |
| Monday, January 1, 2024 | 2103700000 | 3569400000 |
Cracking the code
In the competitive landscape of industrial manufacturing, Lennox International Inc. and Allegion plc have showcased intriguing trends in their cost of revenue over the past decade. From 2014 to 2023, Lennox International Inc. consistently reported higher costs, peaking at approximately $3.43 billion in 2023, marking a 39% increase from 2014. Allegion plc, while maintaining a lower cost base, saw a significant rise of 64% over the same period, reaching around $2.07 billion in 2023. This divergence highlights Lennox's larger scale of operations, while Allegion's rapid growth trajectory suggests strategic expansions. Notably, 2024 data for Allegion is missing, leaving room for speculation on its future financial strategies. As these industry leaders navigate economic challenges, their cost management strategies will be pivotal in shaping their competitive edge.
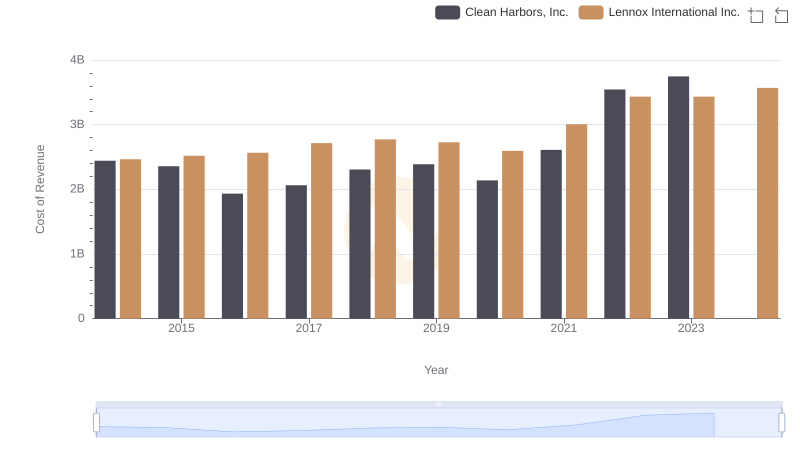
Cost of Revenue Comparison: Lennox International Inc. vs Clean Harbors, Inc.
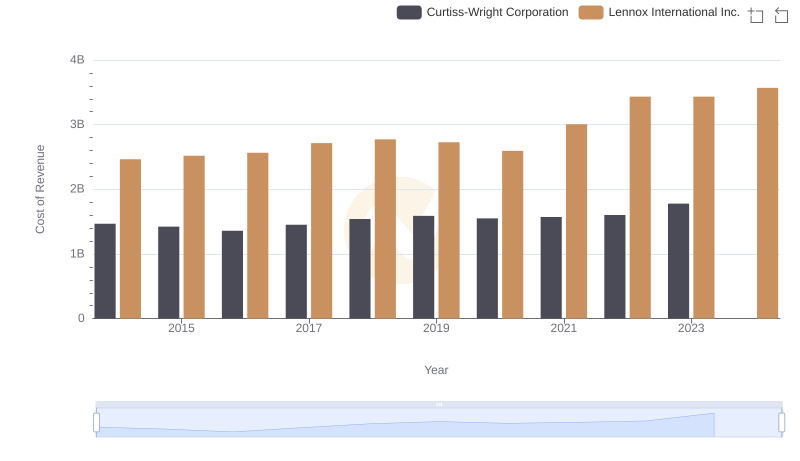
Cost of Revenue Comparison: Lennox International Inc. vs Curtiss-Wright Corporation
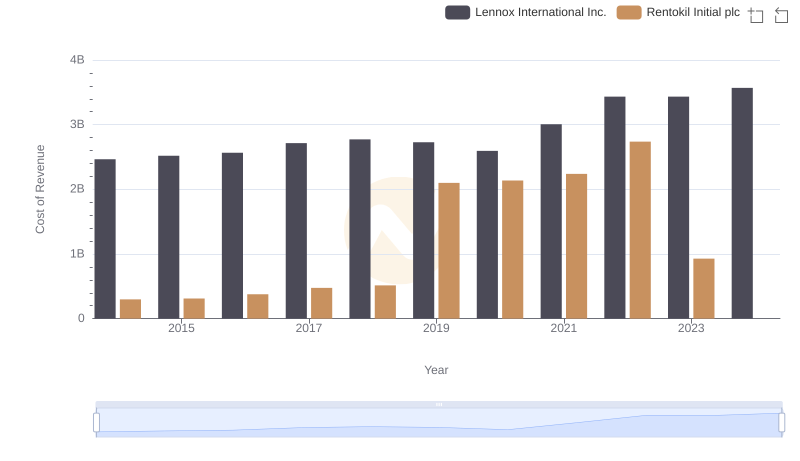
Cost Insights: Breaking Down Lennox International Inc. and Rentokil Initial plc's Expenses
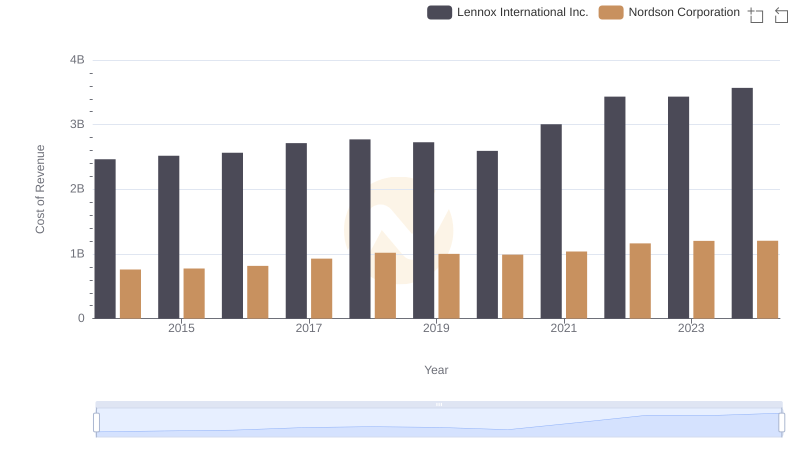
Cost of Revenue: Key Insights for Lennox International Inc. and Nordson Corporation
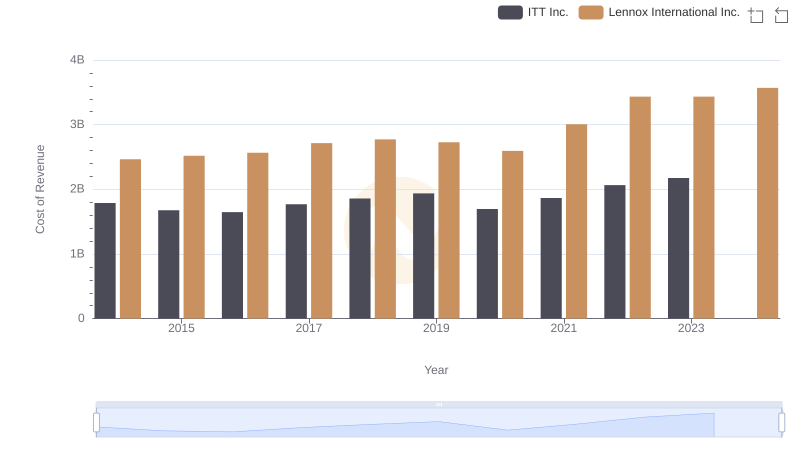
Cost Insights: Breaking Down Lennox International Inc. and ITT Inc.'s Expenses
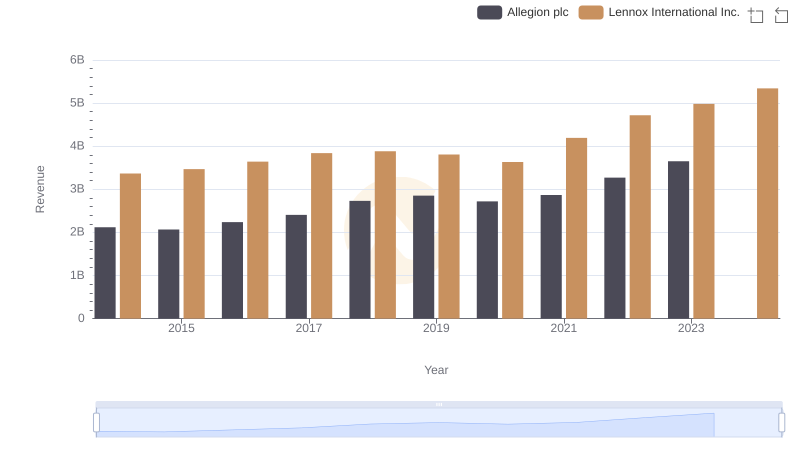
Annual Revenue Comparison: Lennox International Inc. vs Allegion plc
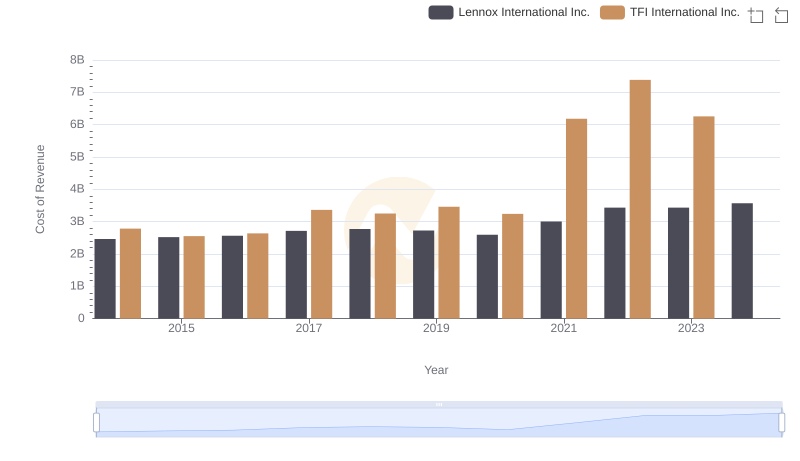
Cost of Revenue Trends: Lennox International Inc. vs TFI International Inc.
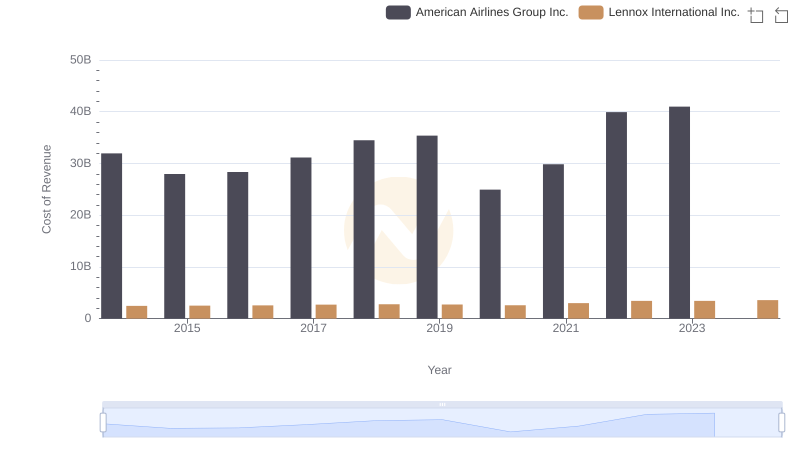
Comparing Cost of Revenue Efficiency: Lennox International Inc. vs American Airlines Group Inc.
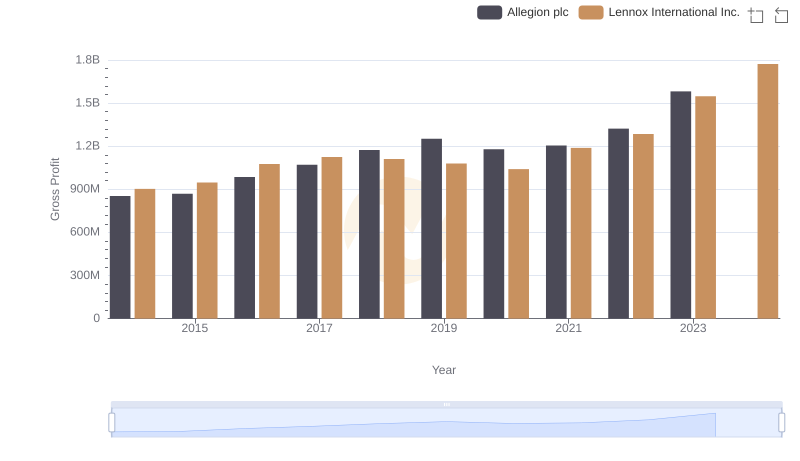
Key Insights on Gross Profit: Lennox International Inc. vs Allegion plc
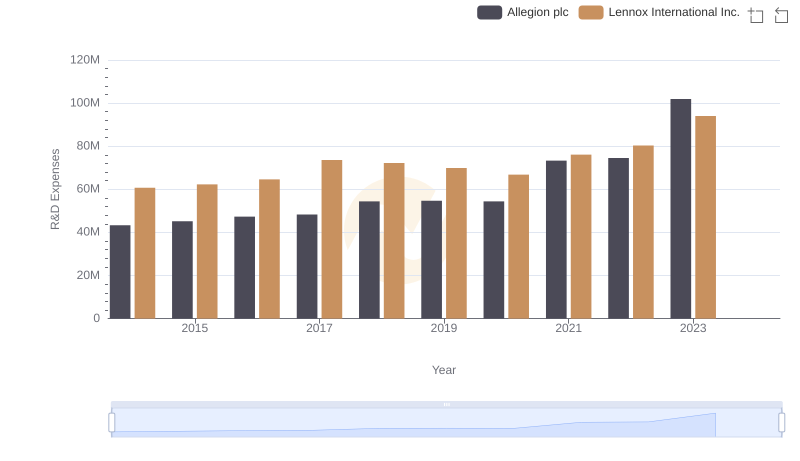
Research and Development: Comparing Key Metrics for Lennox International Inc. and Allegion plc
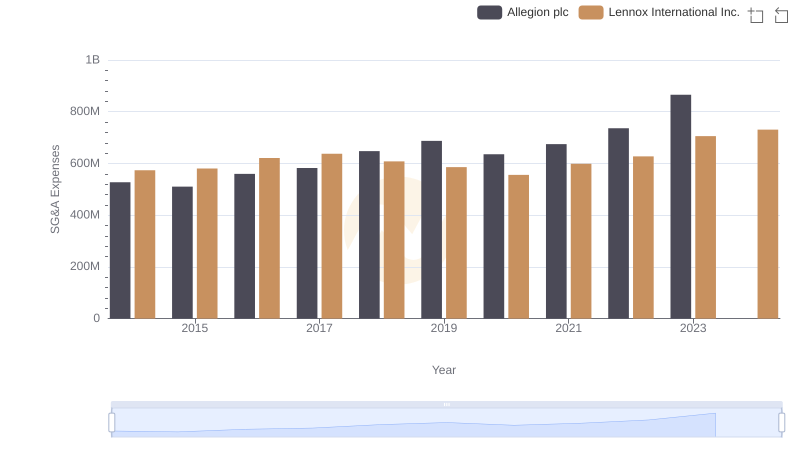
Who Optimizes SG&A Costs Better? Lennox International Inc. or Allegion plc
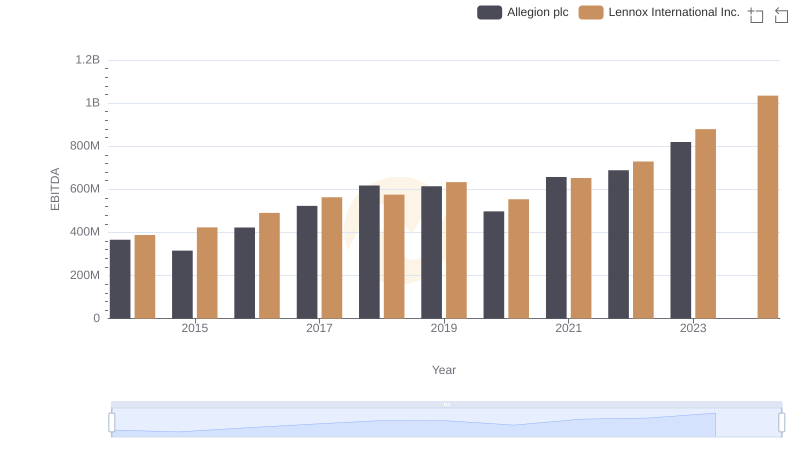
Professional EBITDA Benchmarking: Lennox International Inc. vs Allegion plc