| __timestamp | Elbit Systems Ltd. | Lennox International Inc. |
|---|---|---|
| Wednesday, January 1, 2014 | 2133151000 | 2464100000 |
| Thursday, January 1, 2015 | 2210528000 | 2520000000 |
| Friday, January 1, 2016 | 2300636000 | 2565100000 |
| Sunday, January 1, 2017 | 2379905000 | 2714400000 |
| Monday, January 1, 2018 | 2707505000 | 2772700000 |
| Tuesday, January 1, 2019 | 3371933000 | 2727400000 |
| Wednesday, January 1, 2020 | 3497465000 | 2594000000 |
| Friday, January 1, 2021 | 3920473000 | 3005700000 |
| Saturday, January 1, 2022 | 4138266000 | 3433700000 |
| Sunday, January 1, 2023 | 4491790000 | 3434100000 |
| Monday, January 1, 2024 | 3569400000 |
Unleashing insights
In the ever-evolving landscape of global business, understanding cost structures is crucial. This analysis delves into the cost of revenue trends for Lennox International Inc. and Elbit Systems Ltd. over the past decade. From 2014 to 2023, Elbit Systems Ltd. saw a remarkable 110% increase in its cost of revenue, peaking in 2023. Meanwhile, Lennox International Inc. experienced a steady rise, with a 39% increase over the same period.
The data reveals that Elbit Systems Ltd. consistently outpaced Lennox in cost growth, reflecting its expanding operations and possibly higher input costs. Notably, Lennox's cost of revenue in 2024 is projected to rise further, while Elbit's data for that year remains unavailable. This missing data could indicate a strategic shift or reporting delay. Such insights are invaluable for investors and analysts seeking to understand the financial dynamics of these industry leaders.
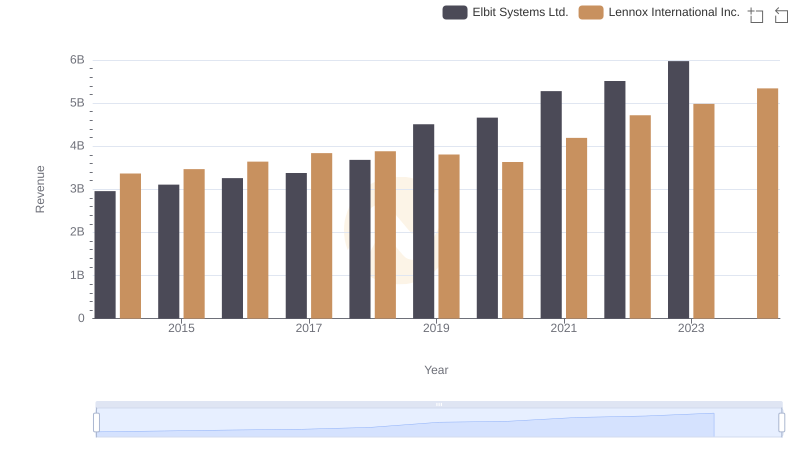
Lennox International Inc. or Elbit Systems Ltd.: Who Leads in Yearly Revenue?
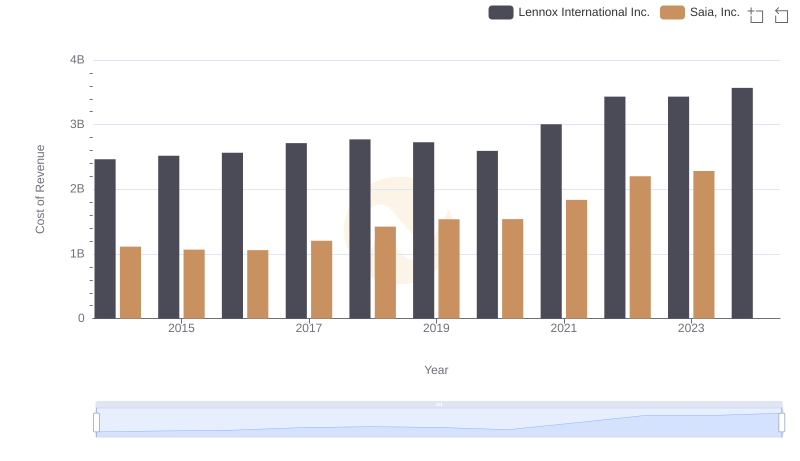
Cost Insights: Breaking Down Lennox International Inc. and Saia, Inc.'s Expenses
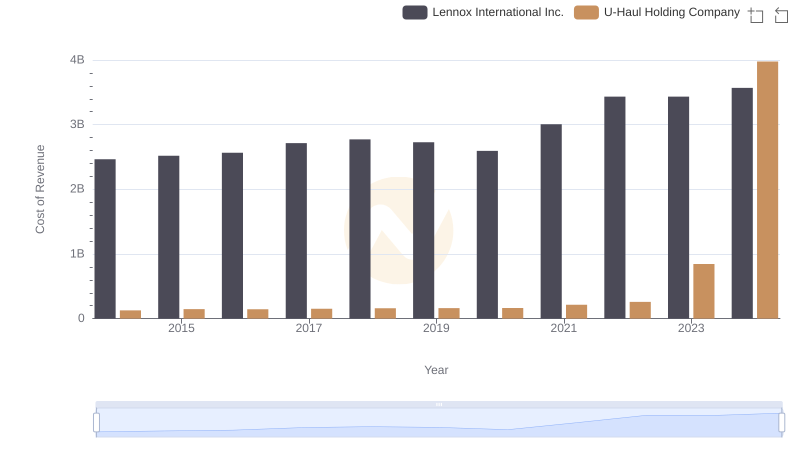
Cost Insights: Breaking Down Lennox International Inc. and U-Haul Holding Company's Expenses
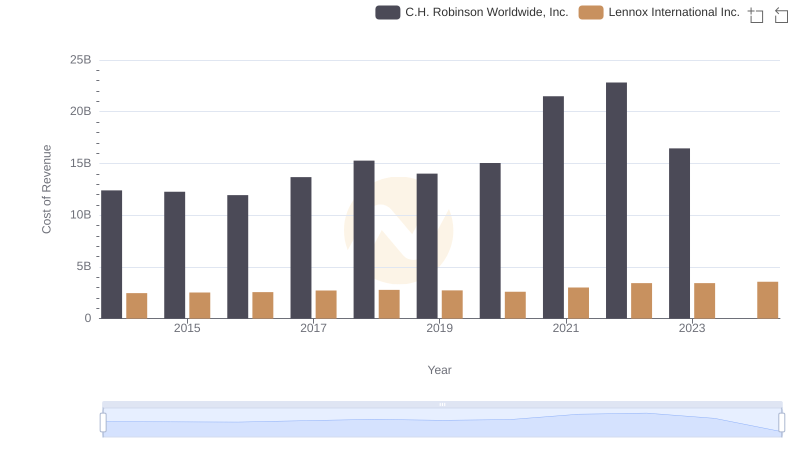
Cost of Revenue: Key Insights for Lennox International Inc. and C.H. Robinson Worldwide, Inc.
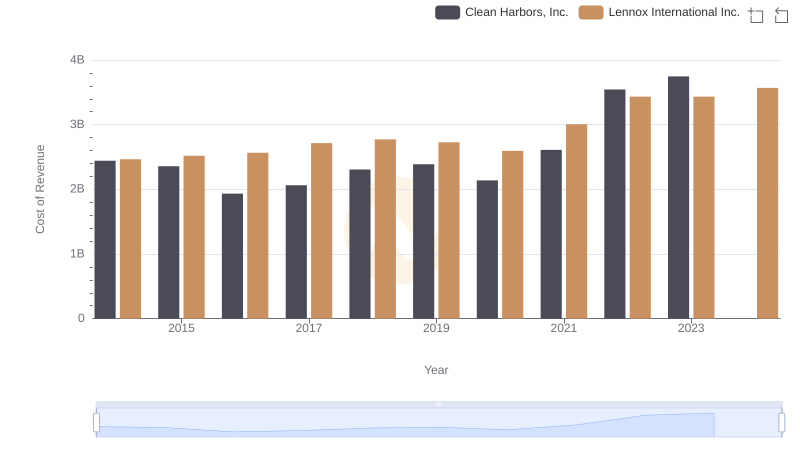
Cost of Revenue Comparison: Lennox International Inc. vs Clean Harbors, Inc.
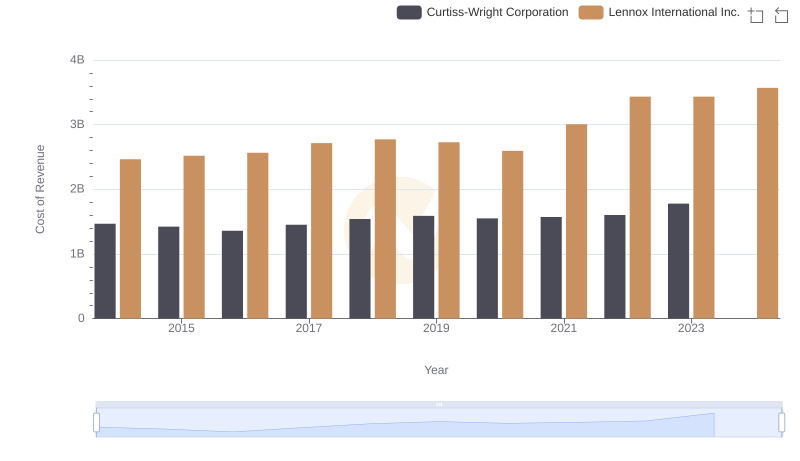
Cost of Revenue Comparison: Lennox International Inc. vs Curtiss-Wright Corporation
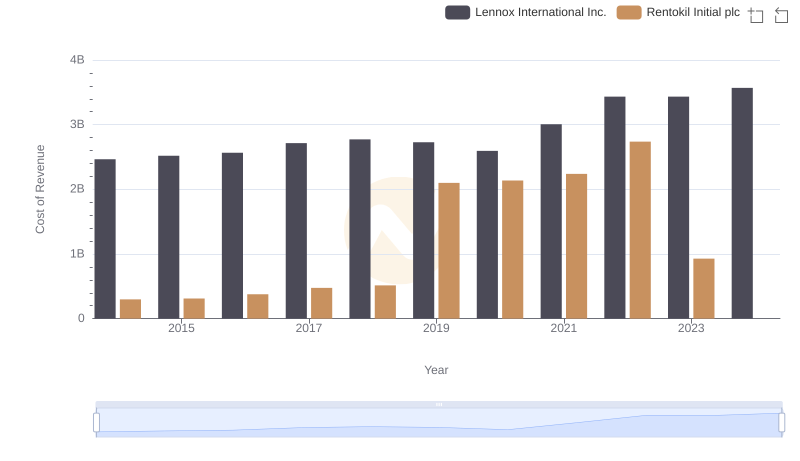
Cost Insights: Breaking Down Lennox International Inc. and Rentokil Initial plc's Expenses
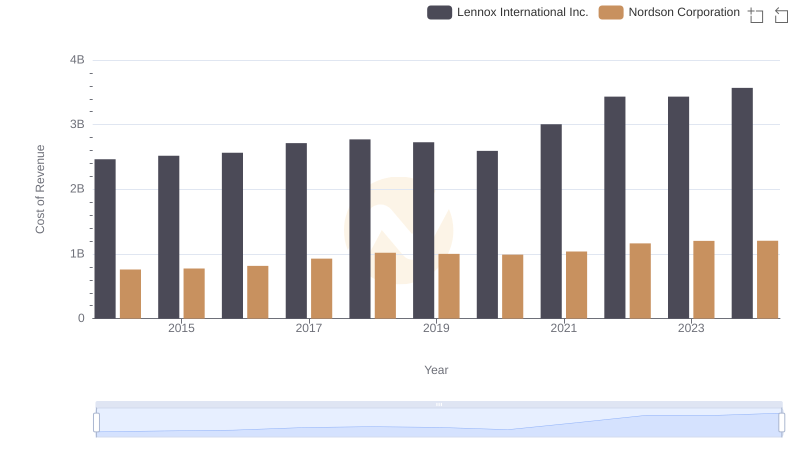
Cost of Revenue: Key Insights for Lennox International Inc. and Nordson Corporation
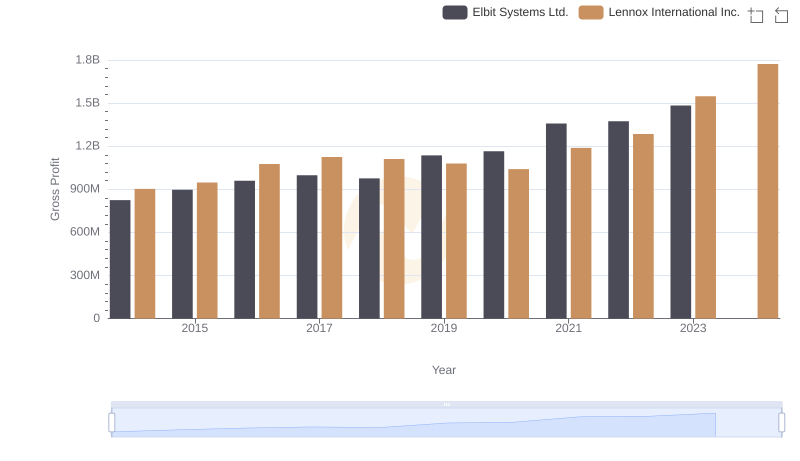
Gross Profit Comparison: Lennox International Inc. and Elbit Systems Ltd. Trends
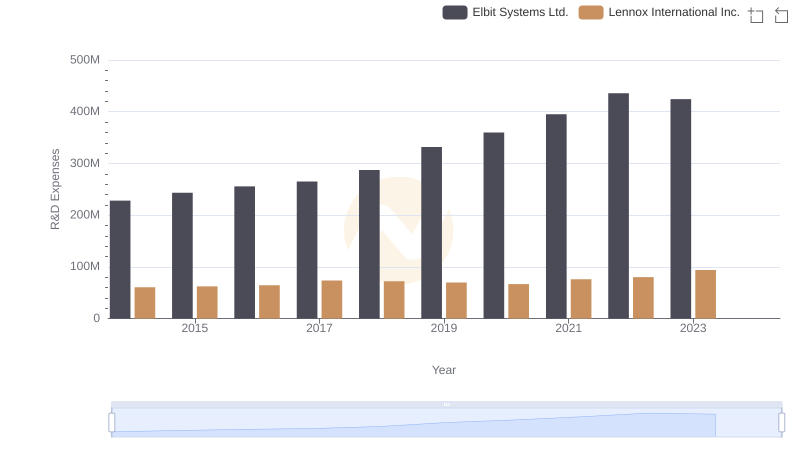
Lennox International Inc. vs Elbit Systems Ltd.: Strategic Focus on R&D Spending
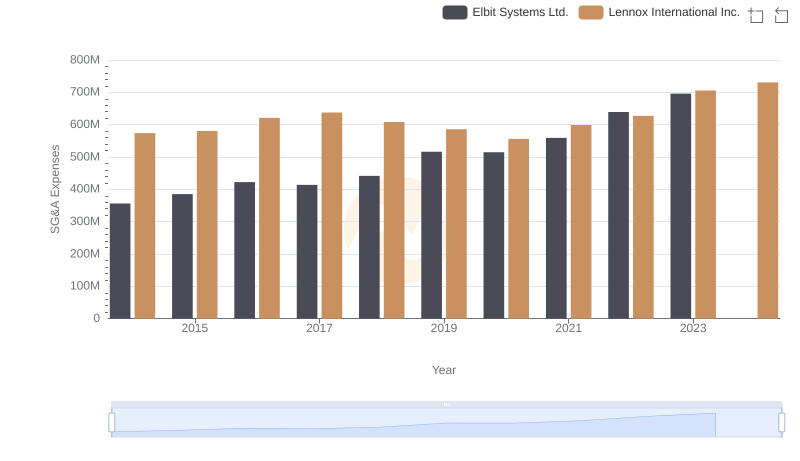
Comparing SG&A Expenses: Lennox International Inc. vs Elbit Systems Ltd. Trends and Insights
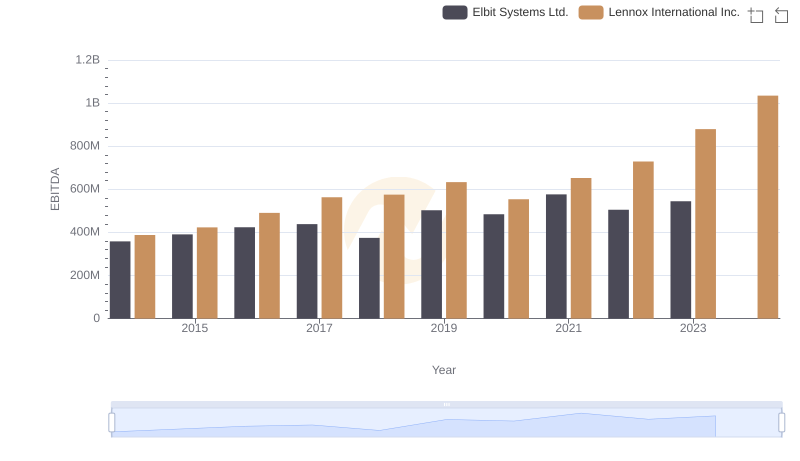
Professional EBITDA Benchmarking: Lennox International Inc. vs Elbit Systems Ltd.