| __timestamp | Cintas Corporation | Watsco, Inc. |
|---|---|---|
| Wednesday, January 1, 2014 | 2637426000 | 2988138000 |
| Thursday, January 1, 2015 | 2555549000 | 3105882000 |
| Friday, January 1, 2016 | 2775588000 | 3186118000 |
| Sunday, January 1, 2017 | 2943086000 | 3276296000 |
| Monday, January 1, 2018 | 3568109000 | 3426401000 |
| Tuesday, January 1, 2019 | 3763715000 | 3613406000 |
| Wednesday, January 1, 2020 | 3851372000 | 3832107000 |
| Friday, January 1, 2021 | 3801689000 | 4612647000 |
| Saturday, January 1, 2022 | 4222213000 | 5244055000 |
| Sunday, January 1, 2023 | 4642401000 | 5291627000 |
| Monday, January 1, 2024 | 4910199000 | 5573604000 |
Unleashing the power of data
In the competitive landscape of industrial services and HVAC distribution, understanding cost dynamics is crucial. Over the past decade, Cintas Corporation and Watsco, Inc. have shown distinct trends in their cost of revenue. From 2014 to 2023, Cintas Corporation's cost of revenue increased by approximately 86%, reflecting strategic growth and expansion. Meanwhile, Watsco, Inc. experienced a 77% rise, indicating robust market demand and operational scaling.
These insights highlight the evolving cost structures and market strategies of these industry leaders, offering valuable perspectives for investors and analysts alike.
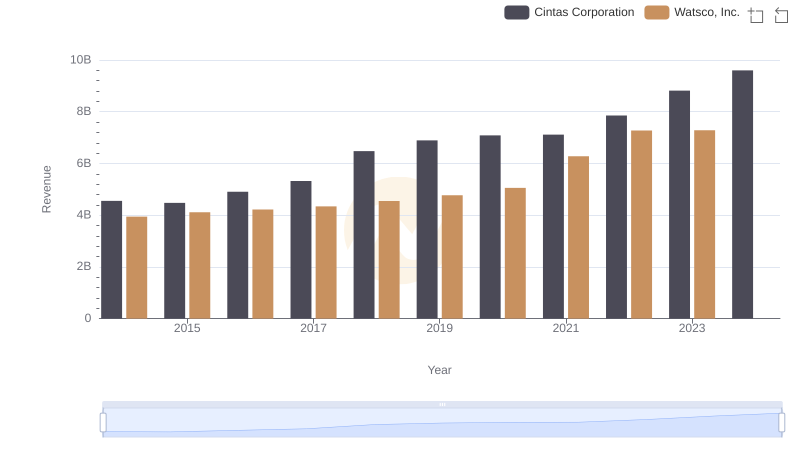
Cintas Corporation vs Watsco, Inc.: Examining Key Revenue Metrics
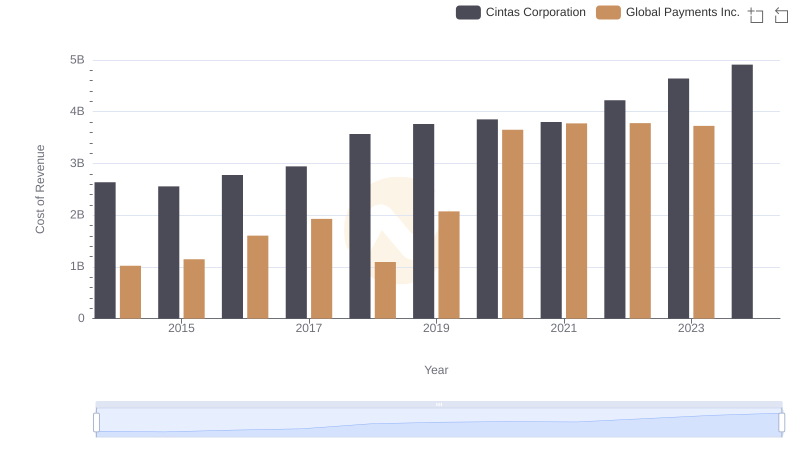
Comparing Cost of Revenue Efficiency: Cintas Corporation vs Global Payments Inc.
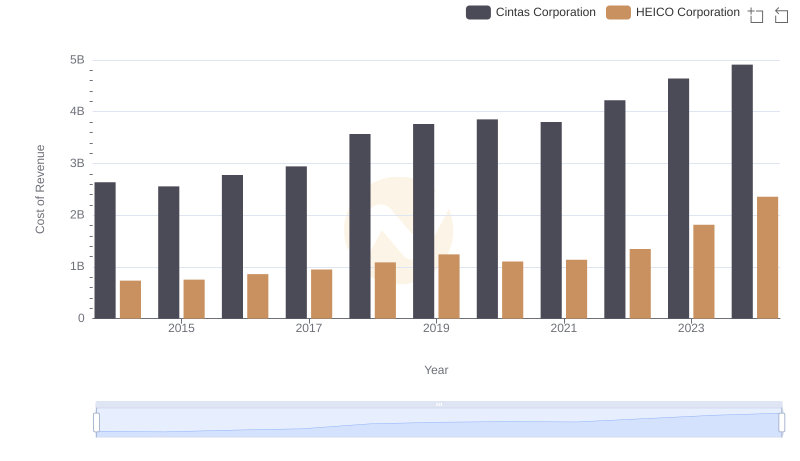
Cintas Corporation vs HEICO Corporation: Efficiency in Cost of Revenue Explored
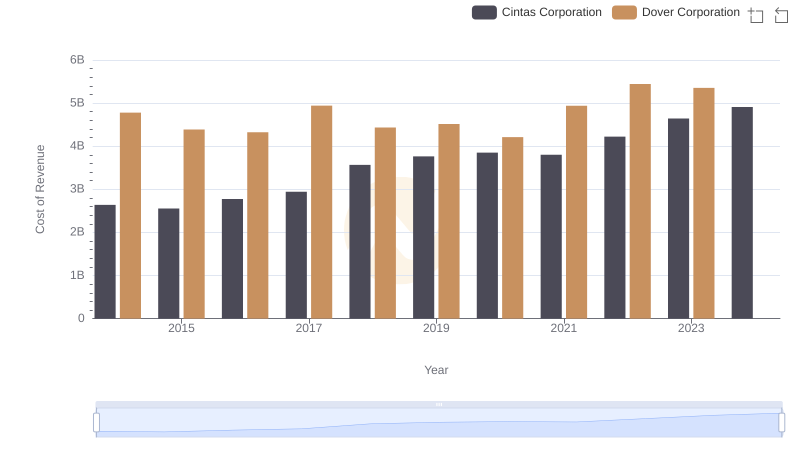
Cost of Revenue Trends: Cintas Corporation vs Dover Corporation
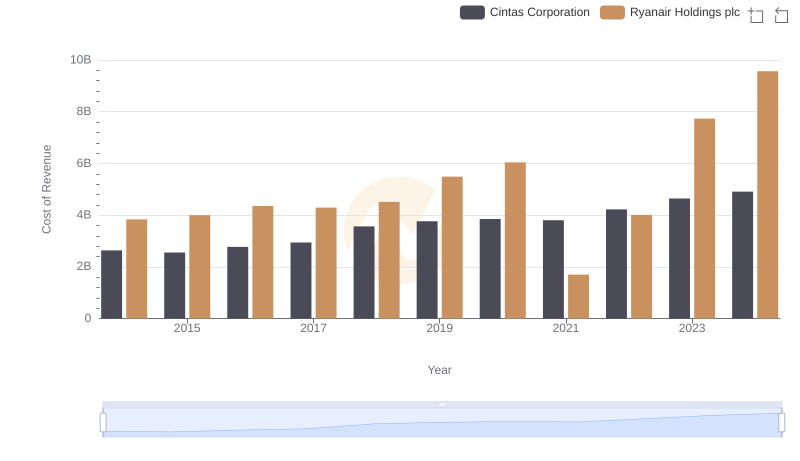
Cost Insights: Breaking Down Cintas Corporation and Ryanair Holdings plc's Expenses
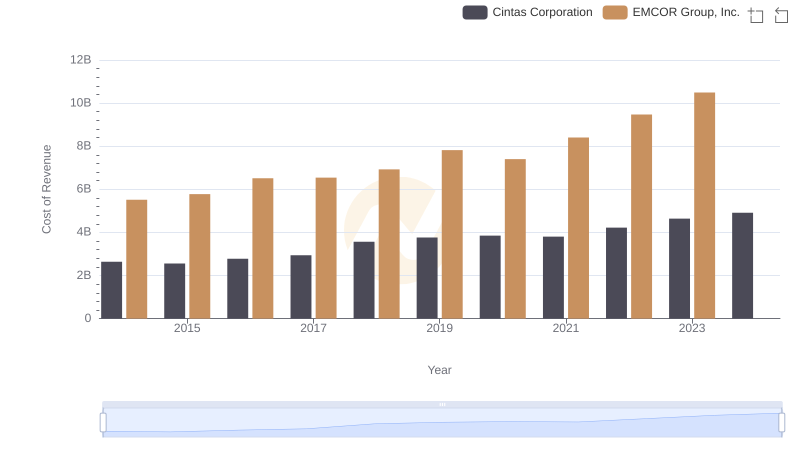
Comparing Cost of Revenue Efficiency: Cintas Corporation vs EMCOR Group, Inc.
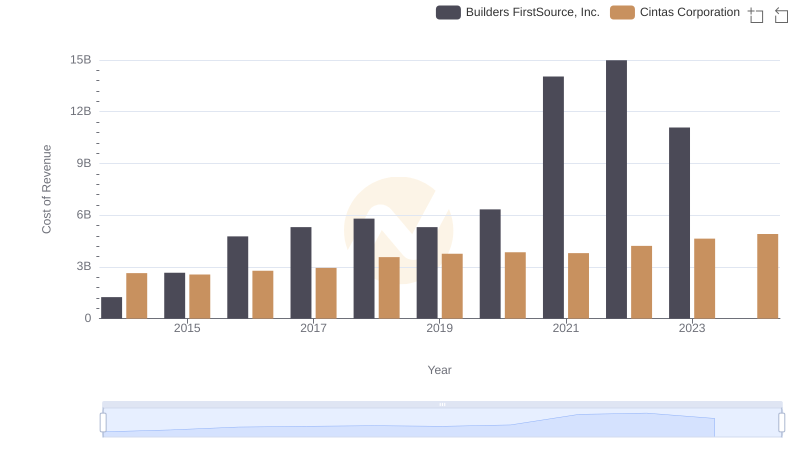
Comparing Cost of Revenue Efficiency: Cintas Corporation vs Builders FirstSource, Inc.
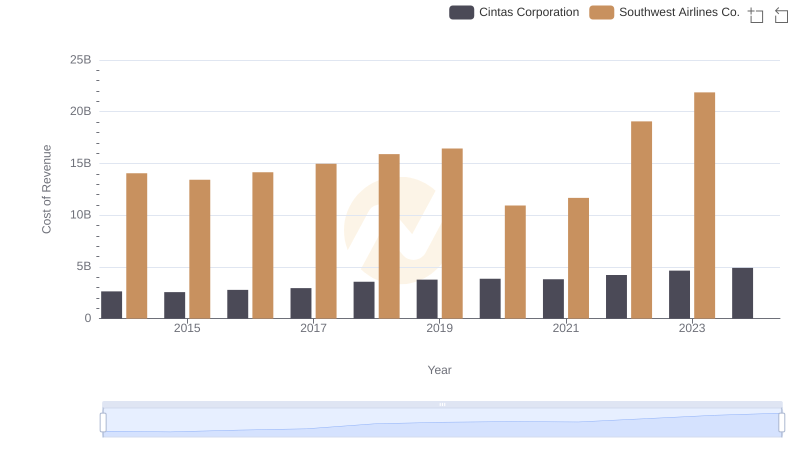
Comparing Cost of Revenue Efficiency: Cintas Corporation vs Southwest Airlines Co.
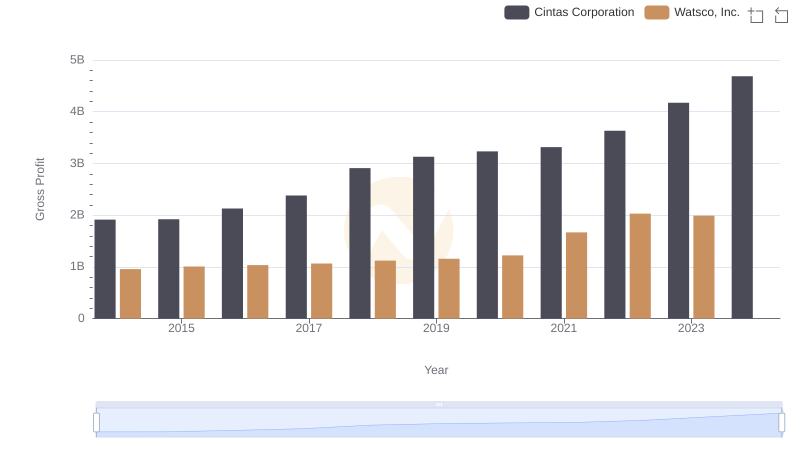
Cintas Corporation and Watsco, Inc.: A Detailed Gross Profit Analysis
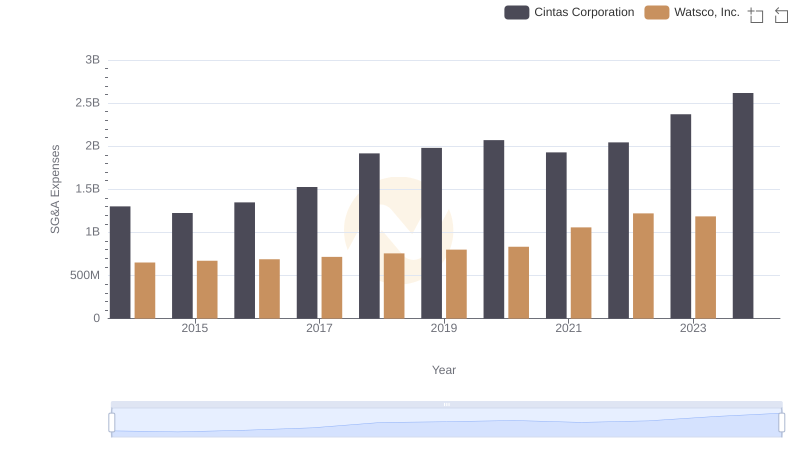
Cintas Corporation vs Watsco, Inc.: SG&A Expense Trends
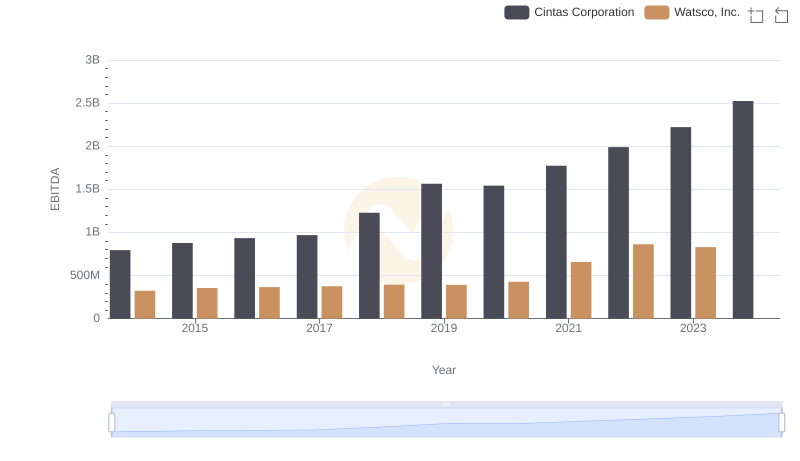
Cintas Corporation and Watsco, Inc.: A Detailed Examination of EBITDA Performance