| __timestamp | Builders FirstSource, Inc. | Cintas Corporation |
|---|---|---|
| Wednesday, January 1, 2014 | 1247099000 | 2637426000 |
| Thursday, January 1, 2015 | 2662967000 | 2555549000 |
| Friday, January 1, 2016 | 4770536000 | 2775588000 |
| Sunday, January 1, 2017 | 5306818000 | 2943086000 |
| Monday, January 1, 2018 | 5801831000 | 3568109000 |
| Tuesday, January 1, 2019 | 5303602000 | 3763715000 |
| Wednesday, January 1, 2020 | 6336290000 | 3851372000 |
| Friday, January 1, 2021 | 14042900000 | 3801689000 |
| Saturday, January 1, 2022 | 14982039000 | 4222213000 |
| Sunday, January 1, 2023 | 11084996000 | 4642401000 |
| Monday, January 1, 2024 | 4910199000 |
Data in motion
In the competitive landscape of the U.S. stock market, understanding cost efficiency is crucial for investors. This analysis compares the cost of revenue efficiency between Cintas Corporation and Builders FirstSource, Inc. over the past decade.
From 2014 to 2023, Builders FirstSource, Inc. has shown a remarkable increase in cost of revenue, peaking at approximately $14.98 billion in 2022, a staggering 1,100% increase from 2014. In contrast, Cintas Corporation has maintained a steady growth, with its cost of revenue rising by about 86% over the same period, reaching around $4.64 billion in 2023.
While Builders FirstSource, Inc. experienced significant fluctuations, Cintas Corporation demonstrated consistent growth. This data highlights the contrasting strategies and market conditions faced by these companies, offering valuable insights for potential investors.
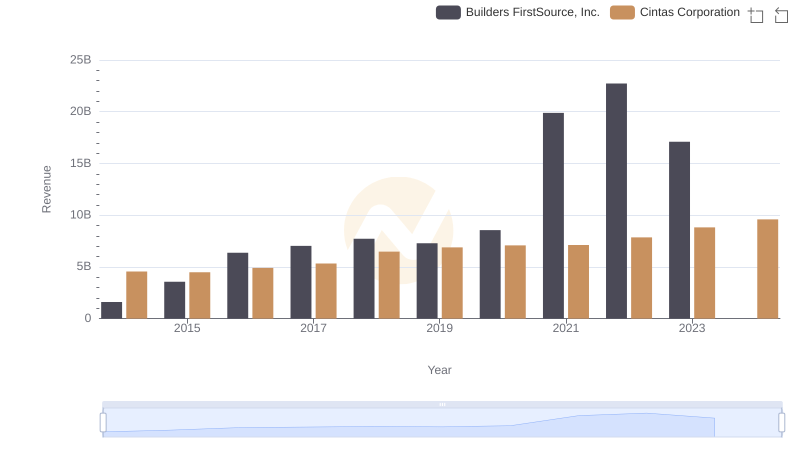
Cintas Corporation vs Builders FirstSource, Inc.: Annual Revenue Growth Compared
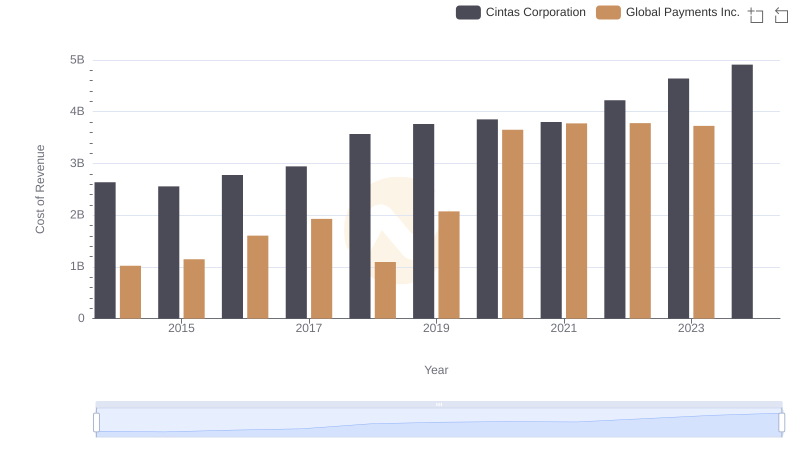
Comparing Cost of Revenue Efficiency: Cintas Corporation vs Global Payments Inc.
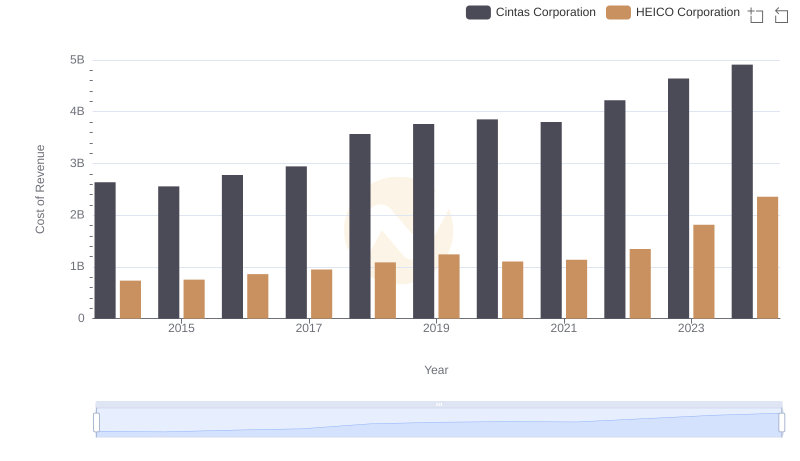
Cintas Corporation vs HEICO Corporation: Efficiency in Cost of Revenue Explored
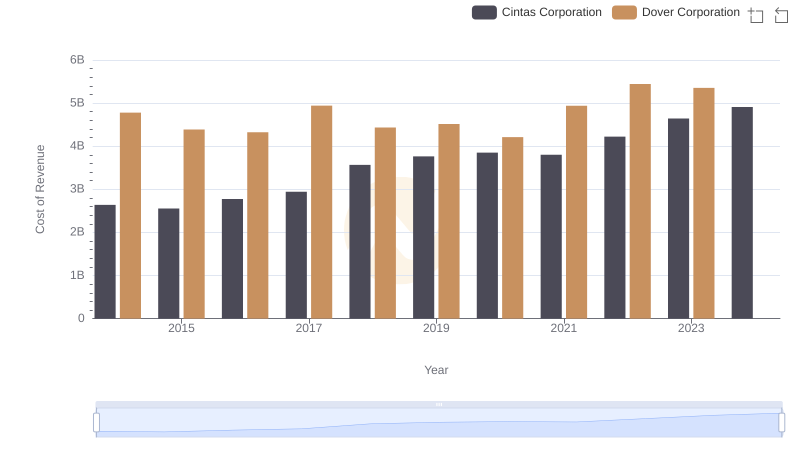
Cost of Revenue Trends: Cintas Corporation vs Dover Corporation
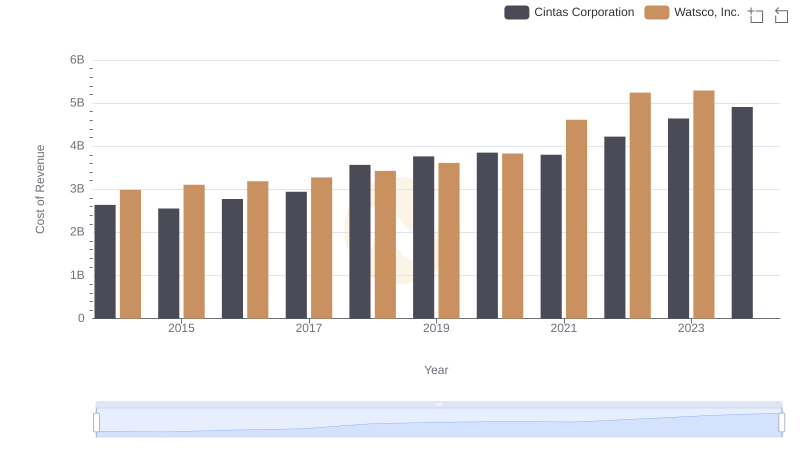
Cost of Revenue: Key Insights for Cintas Corporation and Watsco, Inc.
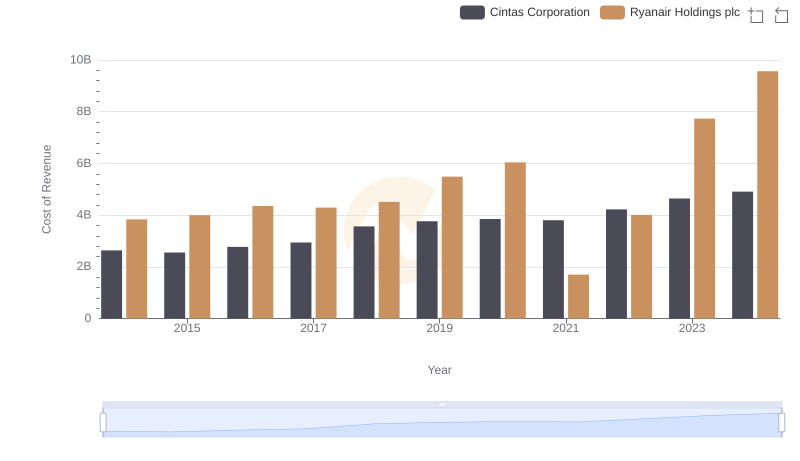
Cost Insights: Breaking Down Cintas Corporation and Ryanair Holdings plc's Expenses
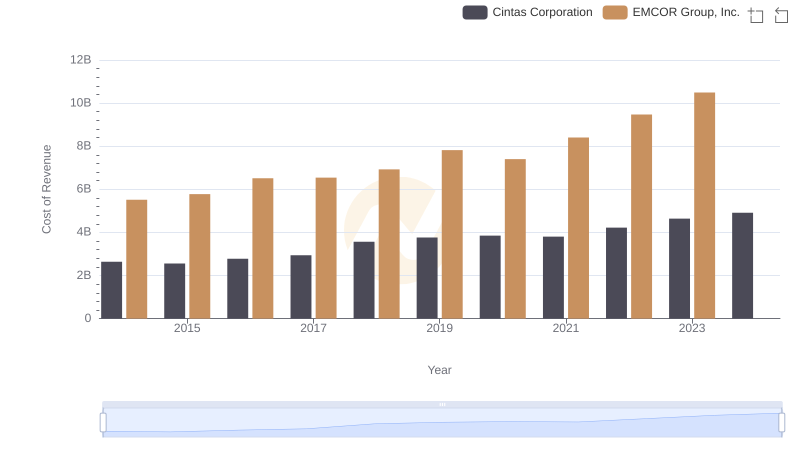
Comparing Cost of Revenue Efficiency: Cintas Corporation vs EMCOR Group, Inc.
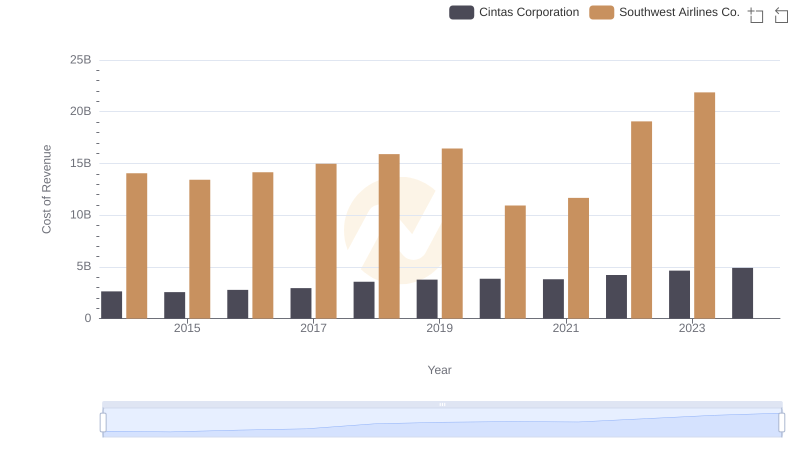
Comparing Cost of Revenue Efficiency: Cintas Corporation vs Southwest Airlines Co.
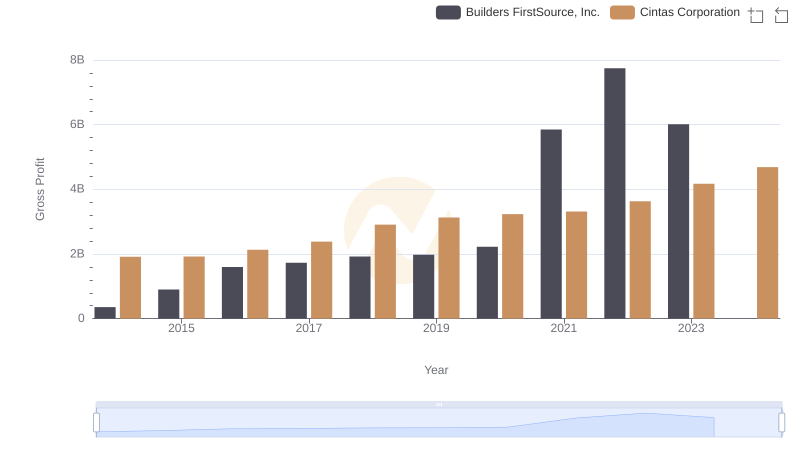
Key Insights on Gross Profit: Cintas Corporation vs Builders FirstSource, Inc.
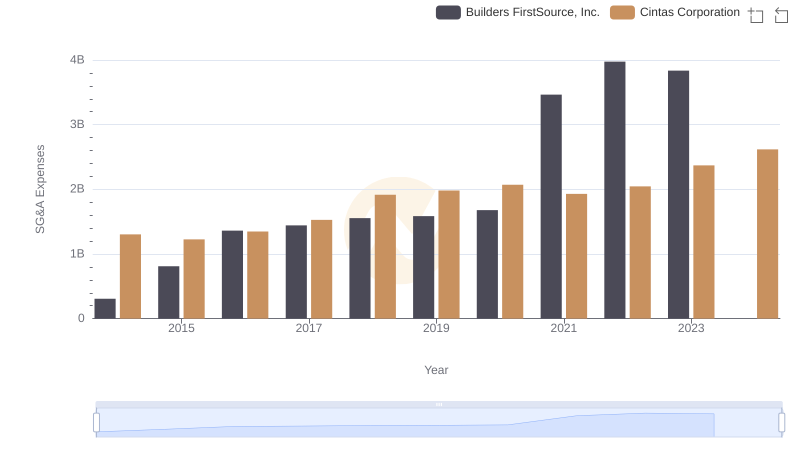
Breaking Down SG&A Expenses: Cintas Corporation vs Builders FirstSource, Inc.
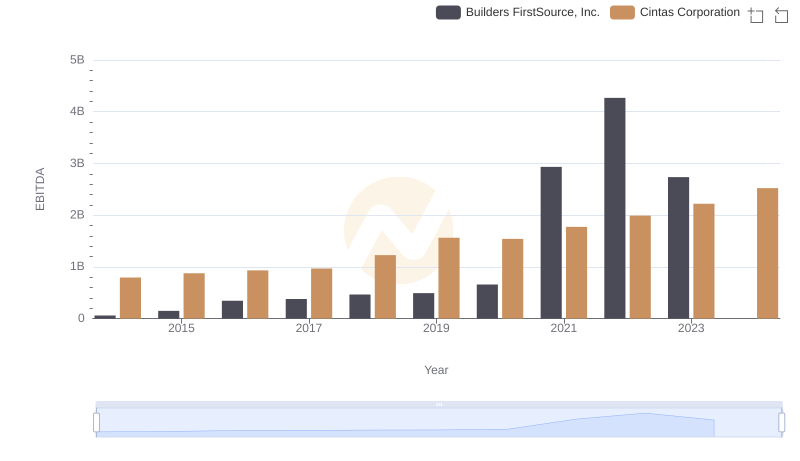
A Side-by-Side Analysis of EBITDA: Cintas Corporation and Builders FirstSource, Inc.