| __timestamp | Cintas Corporation | Nordson Corporation |
|---|---|---|
| Wednesday, January 1, 2014 | 2637426000 | 758923000 |
| Thursday, January 1, 2015 | 2555549000 | 774702000 |
| Friday, January 1, 2016 | 2775588000 | 815495000 |
| Sunday, January 1, 2017 | 2943086000 | 927981000 |
| Monday, January 1, 2018 | 3568109000 | 1018703000 |
| Tuesday, January 1, 2019 | 3763715000 | 1002123000 |
| Wednesday, January 1, 2020 | 3851372000 | 990632000 |
| Friday, January 1, 2021 | 3801689000 | 1038129000 |
| Saturday, January 1, 2022 | 4222213000 | 1163742000 |
| Sunday, January 1, 2023 | 4642401000 | 1203227000 |
| Monday, January 1, 2024 | 4910199000 | 1203792000 |
Infusing magic into the data realm
In the competitive landscape of industrial services and manufacturing, cost efficiency is a critical metric. Over the past decade, Cintas Corporation and Nordson Corporation have demonstrated distinct trajectories in managing their cost of revenue.
Cintas, a leader in corporate identity uniforms and facility services, has seen its cost of revenue grow by approximately 86% from 2014 to 2024. This increase reflects its expanding operations and market reach. In contrast, Nordson, a specialist in precision dispensing equipment, has maintained a more stable cost structure, with a growth of about 59% over the same period.
The data reveals that while both companies have increased their cost of revenue, Cintas's growth rate is notably higher. This could indicate a more aggressive expansion strategy or increased operational costs. Investors and industry analysts should consider these trends when evaluating the financial health and strategic direction of these corporations.
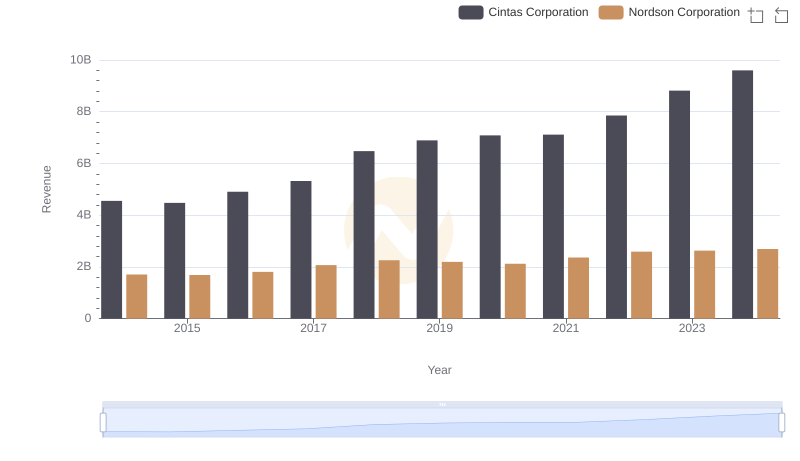
Cintas Corporation vs Nordson Corporation: Annual Revenue Growth Compared
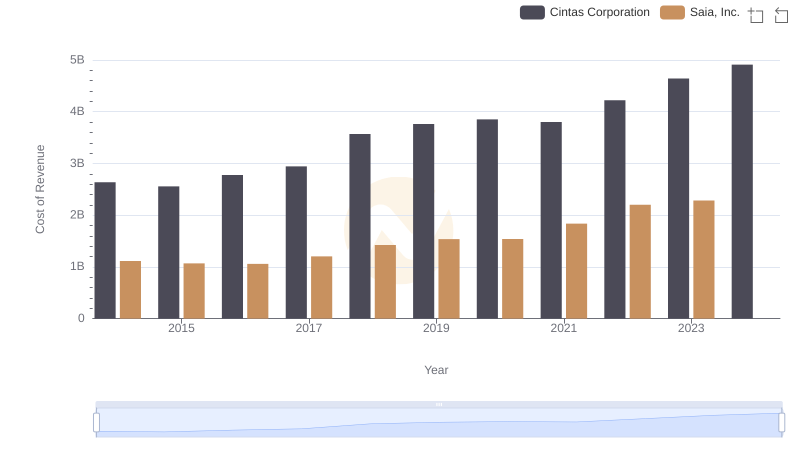
Cost of Revenue Trends: Cintas Corporation vs Saia, Inc.
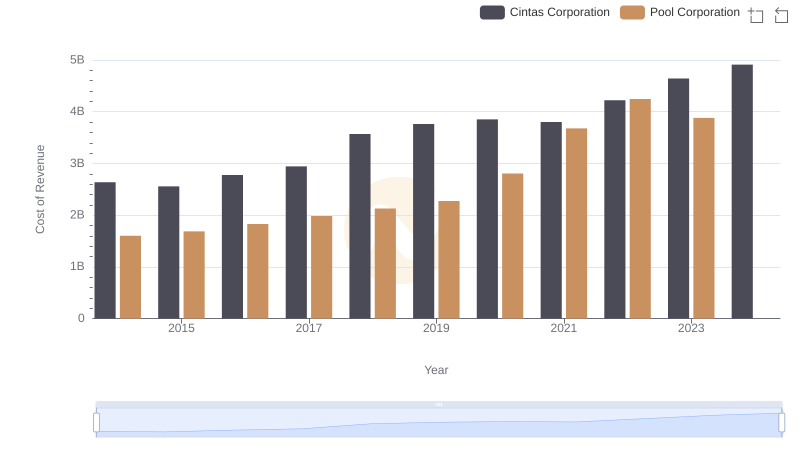
Cost of Revenue: Key Insights for Cintas Corporation and Pool Corporation
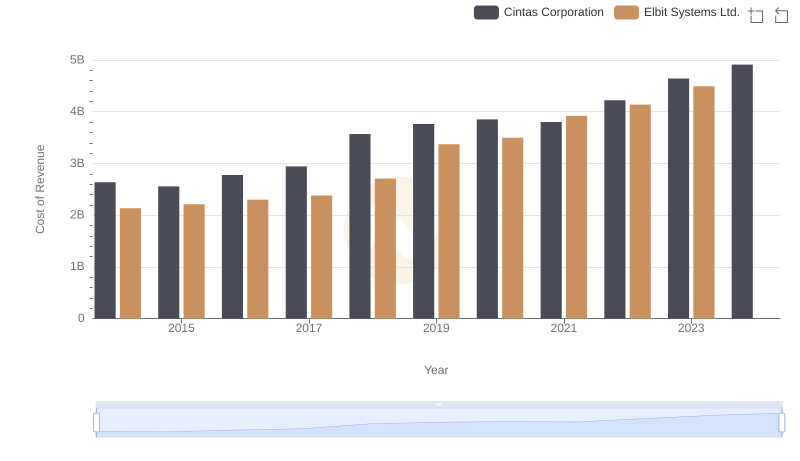
Analyzing Cost of Revenue: Cintas Corporation and Elbit Systems Ltd.
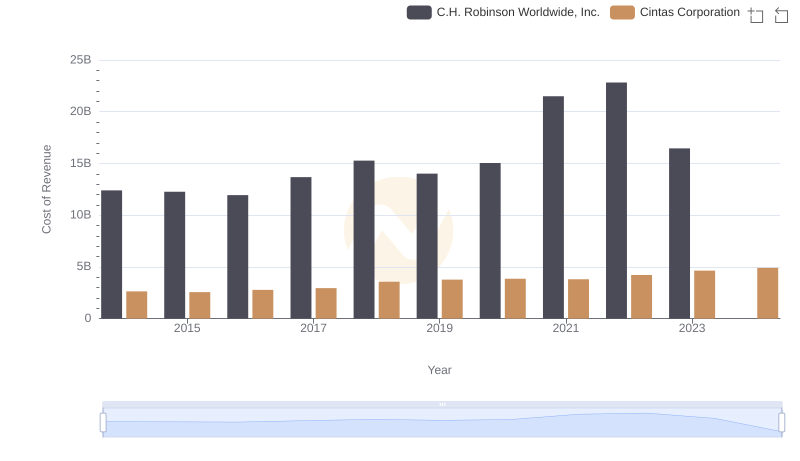
Cost of Revenue Trends: Cintas Corporation vs C.H. Robinson Worldwide, Inc.
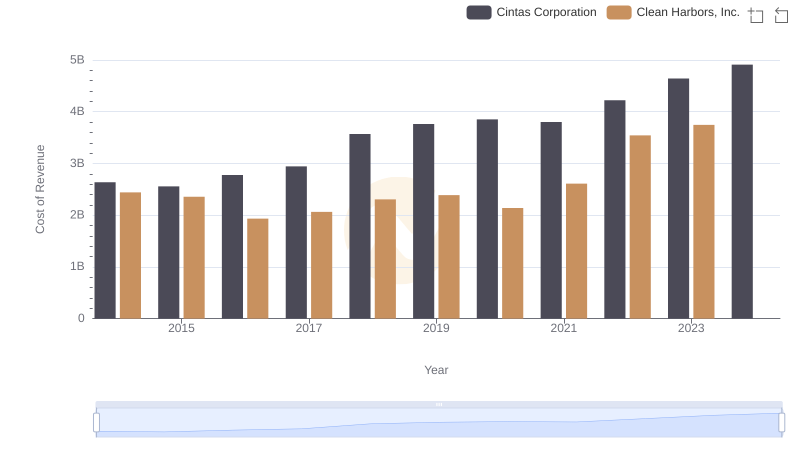
Analyzing Cost of Revenue: Cintas Corporation and Clean Harbors, Inc.
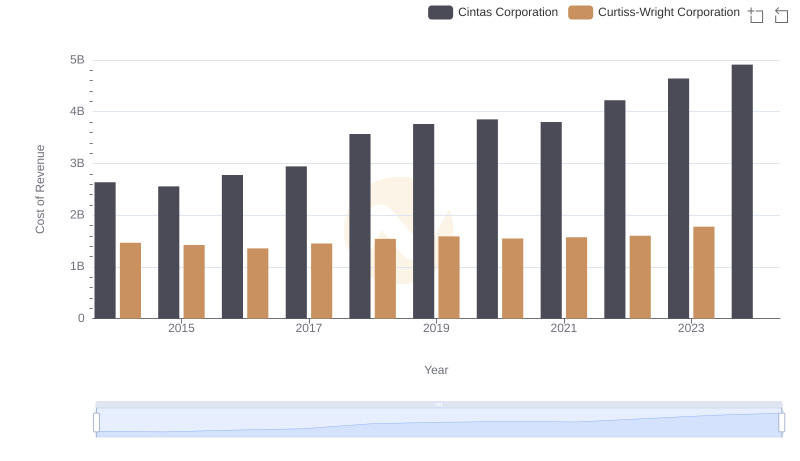
Cost of Revenue Comparison: Cintas Corporation vs Curtiss-Wright Corporation
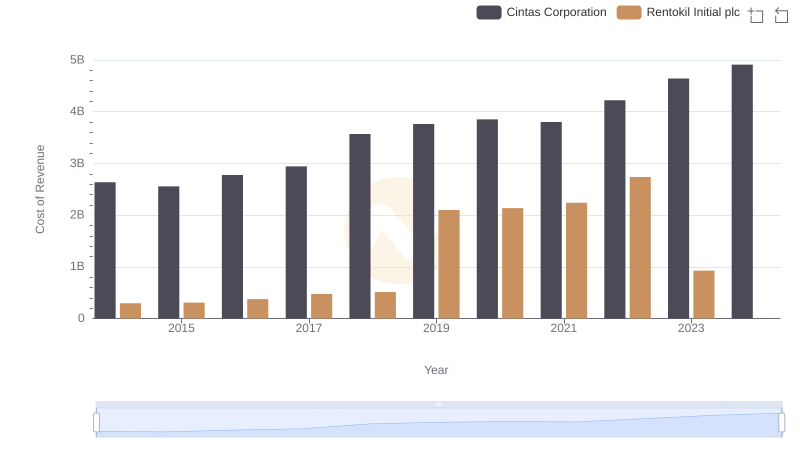
Cintas Corporation vs Rentokil Initial plc: Efficiency in Cost of Revenue Explored
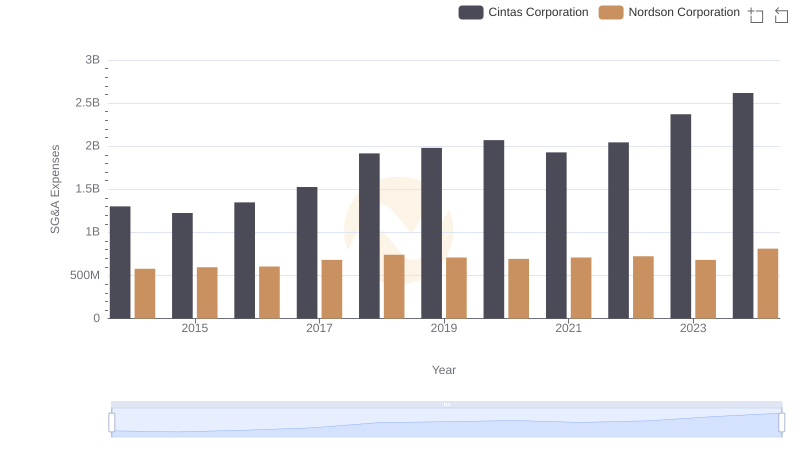
Breaking Down SG&A Expenses: Cintas Corporation vs Nordson Corporation
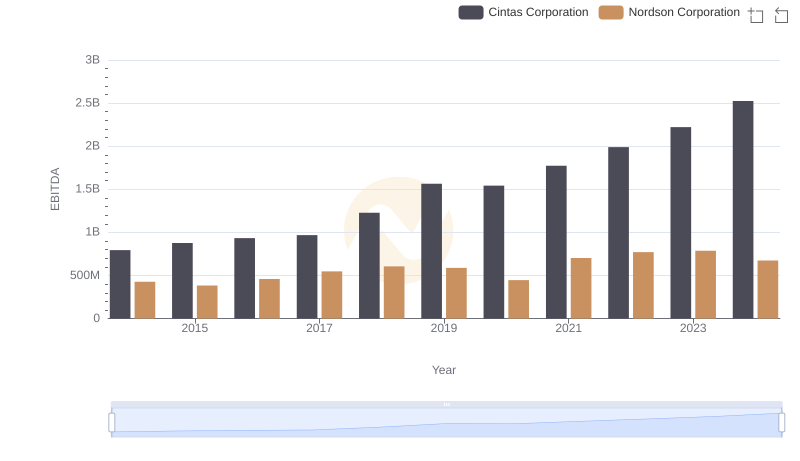
Comparative EBITDA Analysis: Cintas Corporation vs Nordson Corporation