| __timestamp | Cintas Corporation | Saia, Inc. |
|---|---|---|
| Wednesday, January 1, 2014 | 793811000 | 144715000 |
| Thursday, January 1, 2015 | 877761000 | 154995000 |
| Friday, January 1, 2016 | 933728000 | 156092000 |
| Sunday, January 1, 2017 | 968293000 | 181629000 |
| Monday, January 1, 2018 | 1227852000 | 243709000 |
| Tuesday, January 1, 2019 | 1564228000 | 271318000 |
| Wednesday, January 1, 2020 | 1542737000 | 312448000 |
| Friday, January 1, 2021 | 1773591000 | 472947000 |
| Saturday, January 1, 2022 | 1990046000 | 627741000 |
| Sunday, January 1, 2023 | 2221676000 | 647607000 |
| Monday, January 1, 2024 | 2523857000 |
Unleashing insights
In the ever-evolving landscape of corporate finance, EBITDA serves as a crucial indicator of a company's operational efficiency. Over the past decade, Cintas Corporation and Saia, Inc. have demonstrated remarkable growth in this metric. From 2014 to 2023, Cintas Corporation's EBITDA surged by approximately 218%, reflecting its robust business model and strategic expansions. Meanwhile, Saia, Inc. showcased an impressive 347% increase, underscoring its agility in the competitive logistics sector.
The data for 2024 remains incomplete, hinting at potential future developments.
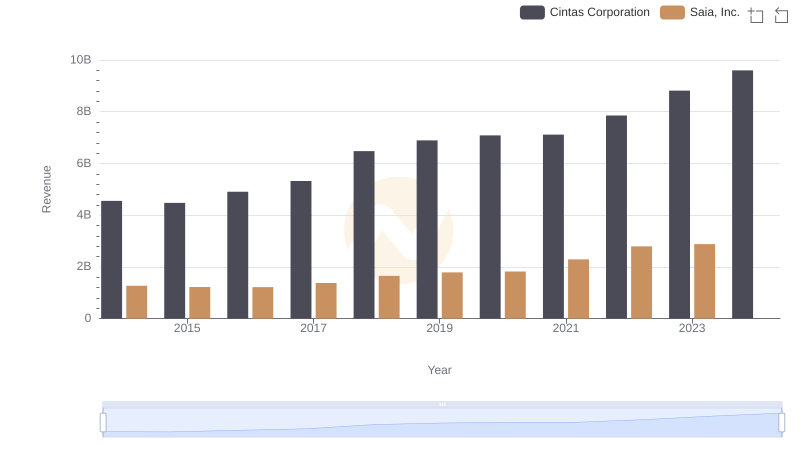
Cintas Corporation vs Saia, Inc.: Examining Key Revenue Metrics
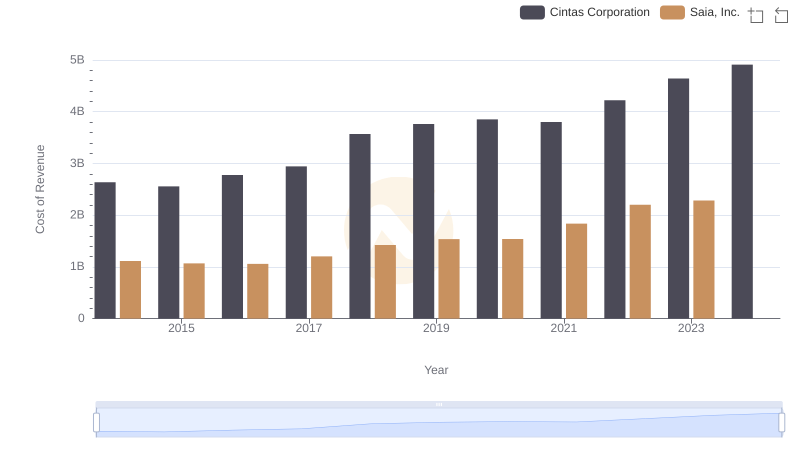
Cost of Revenue Trends: Cintas Corporation vs Saia, Inc.
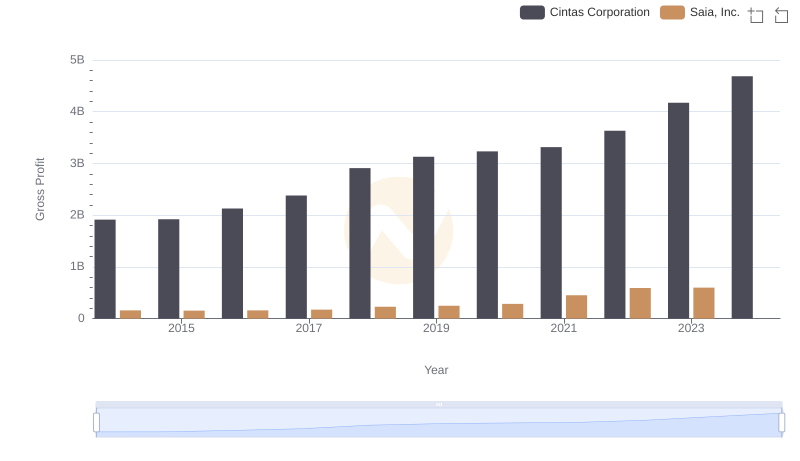
Who Generates Higher Gross Profit? Cintas Corporation or Saia, Inc.
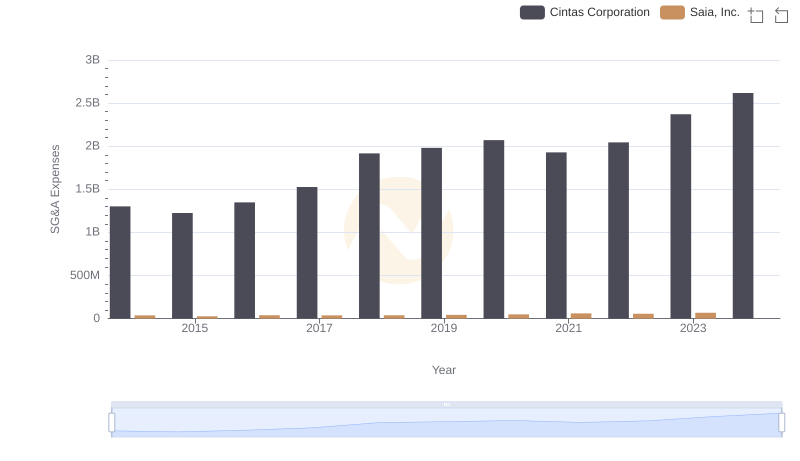
Selling, General, and Administrative Costs: Cintas Corporation vs Saia, Inc.
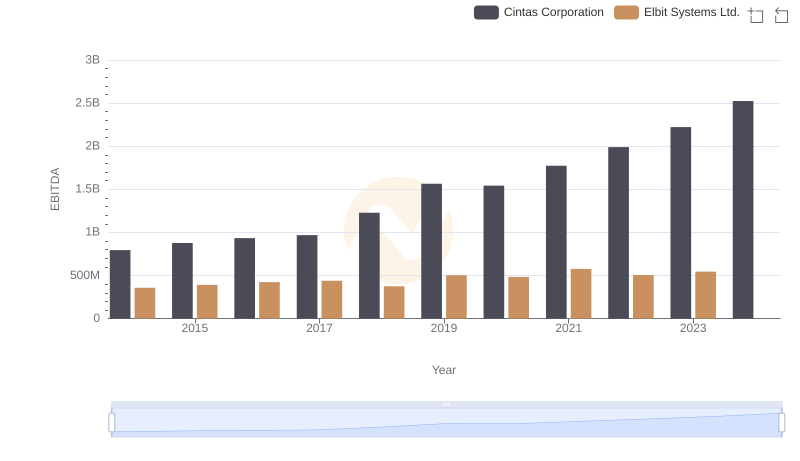
Comprehensive EBITDA Comparison: Cintas Corporation vs Elbit Systems Ltd.
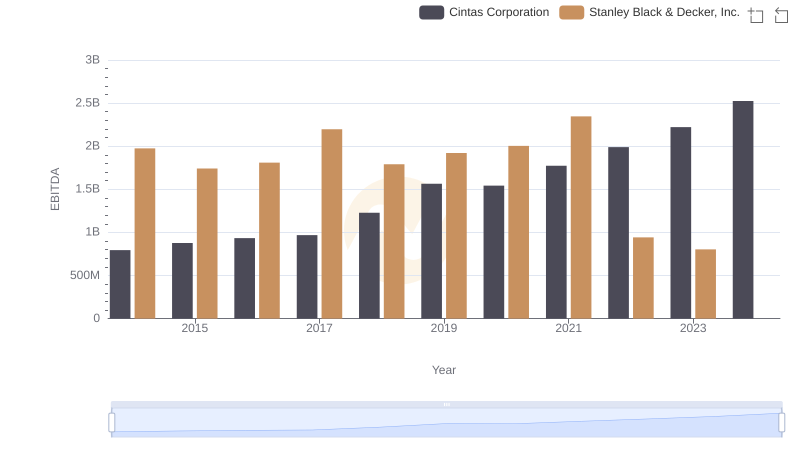
Comprehensive EBITDA Comparison: Cintas Corporation vs Stanley Black & Decker, Inc.
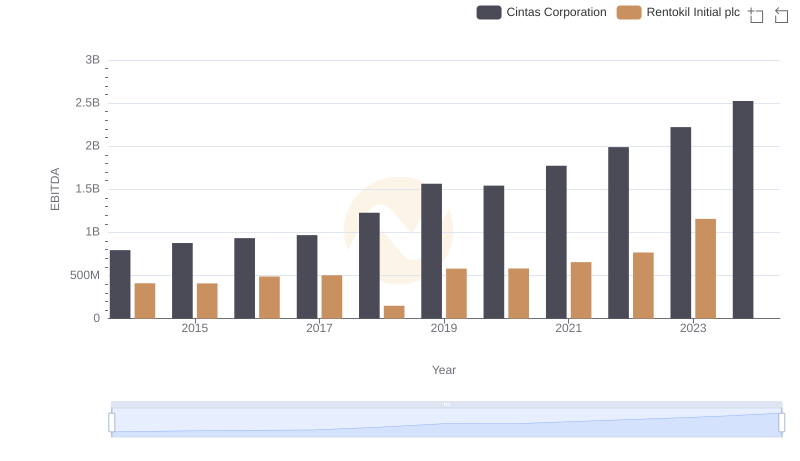
Comparative EBITDA Analysis: Cintas Corporation vs Rentokil Initial plc
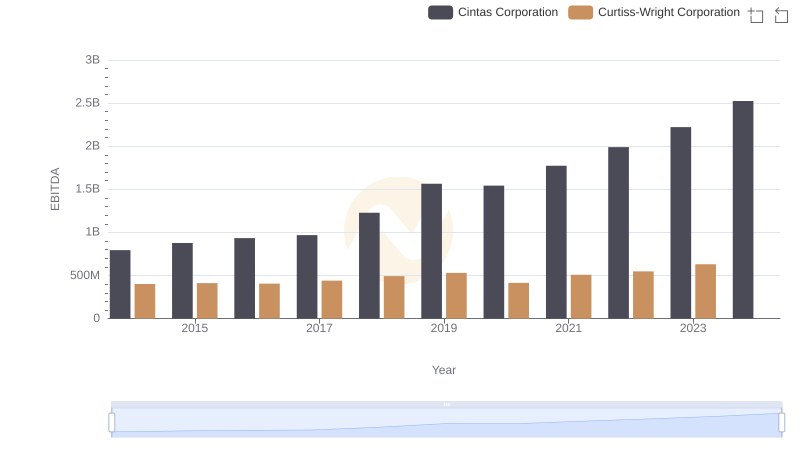
Comprehensive EBITDA Comparison: Cintas Corporation vs Curtiss-Wright Corporation
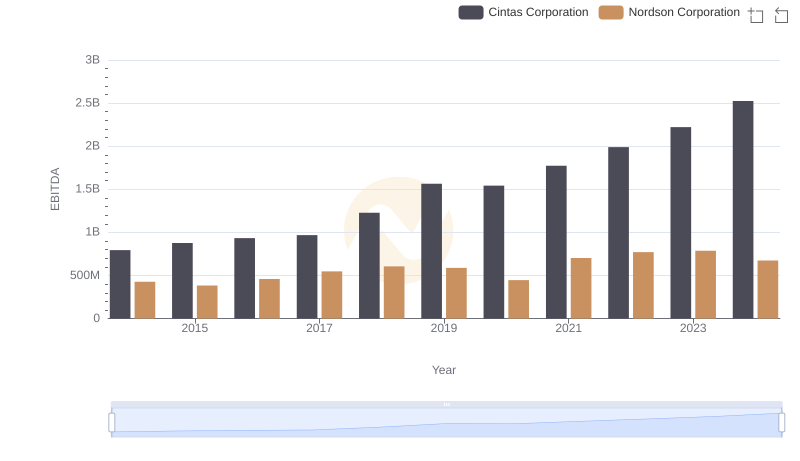
Comparative EBITDA Analysis: Cintas Corporation vs Nordson Corporation
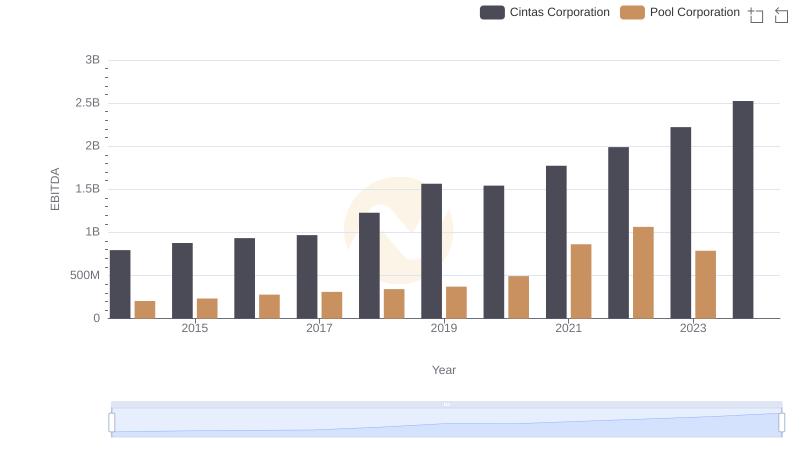
Comparative EBITDA Analysis: Cintas Corporation vs Pool Corporation