| __timestamp | Cintas Corporation | Clean Harbors, Inc. |
|---|---|---|
| Wednesday, January 1, 2014 | 2637426000 | 2441796000 |
| Thursday, January 1, 2015 | 2555549000 | 2356806000 |
| Friday, January 1, 2016 | 2775588000 | 1932857000 |
| Sunday, January 1, 2017 | 2943086000 | 2062673000 |
| Monday, January 1, 2018 | 3568109000 | 2305551000 |
| Tuesday, January 1, 2019 | 3763715000 | 2387819000 |
| Wednesday, January 1, 2020 | 3851372000 | 2137751000 |
| Friday, January 1, 2021 | 3801689000 | 2609837000 |
| Saturday, January 1, 2022 | 4222213000 | 3543930000 |
| Sunday, January 1, 2023 | 4642401000 | 3746124000 |
| Monday, January 1, 2024 | 4910199000 | 4065713000 |
Igniting the spark of knowledge
In the competitive landscape of industrial services, Cintas Corporation and Clean Harbors, Inc. have shown distinct trajectories in their cost of revenue over the past decade. From 2014 to 2023, Cintas Corporation's cost of revenue surged by approximately 86%, reflecting its robust growth and expansion strategies. In contrast, Clean Harbors, Inc. experienced a more modest increase of around 53% during the same period.
Cintas Corporation consistently outpaced Clean Harbors, Inc., with its cost of revenue peaking at nearly $4.64 billion in 2023. This growth underscores Cintas's strategic investments and operational efficiencies. Meanwhile, Clean Harbors, Inc. reached its highest cost of revenue in 2023, at about $3.75 billion, indicating steady progress despite market challenges.
Notably, data for Clean Harbors, Inc. in 2024 is unavailable, suggesting potential reporting delays or strategic shifts. This gap invites speculation about future trends and market dynamics.
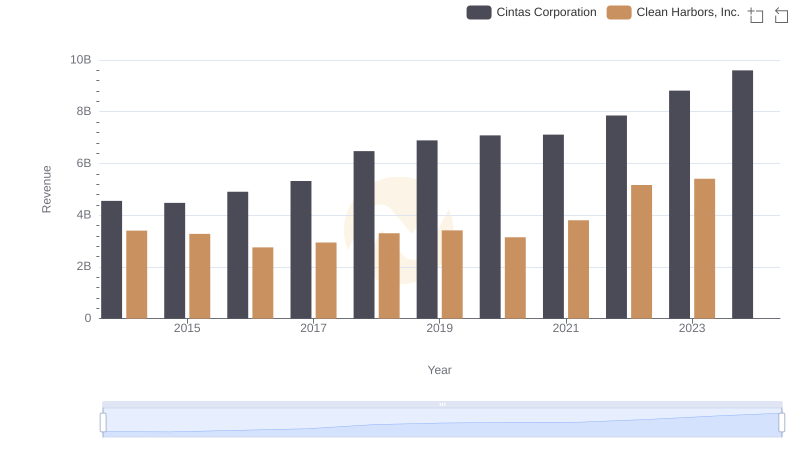
Revenue Insights: Cintas Corporation and Clean Harbors, Inc. Performance Compared
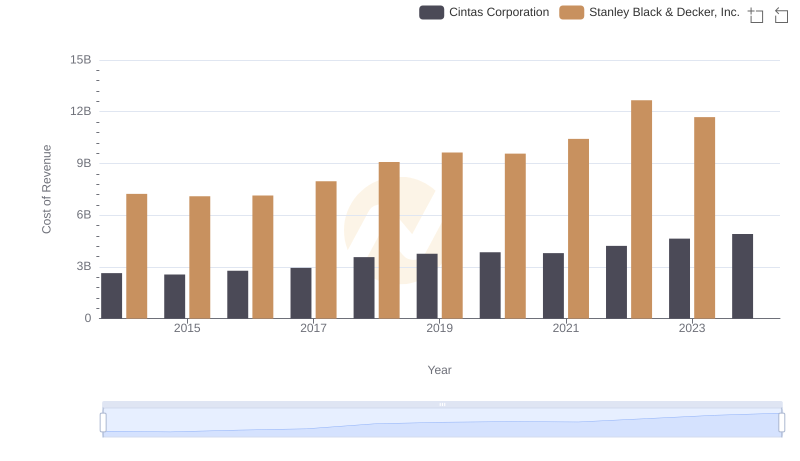
Analyzing Cost of Revenue: Cintas Corporation and Stanley Black & Decker, Inc.
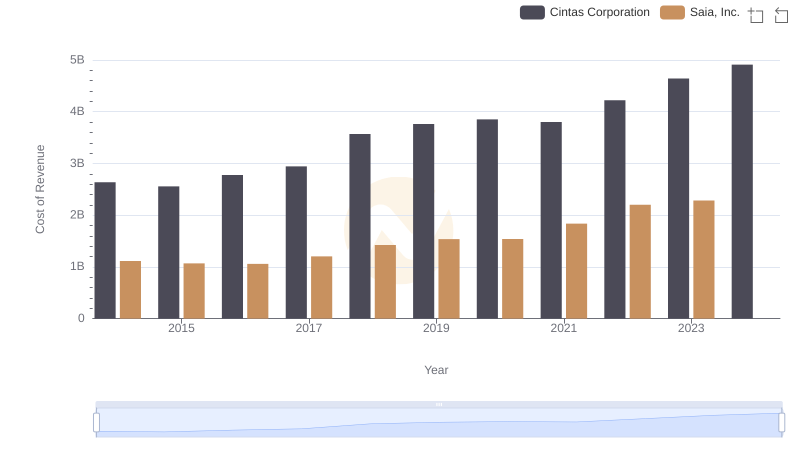
Cost of Revenue Trends: Cintas Corporation vs Saia, Inc.
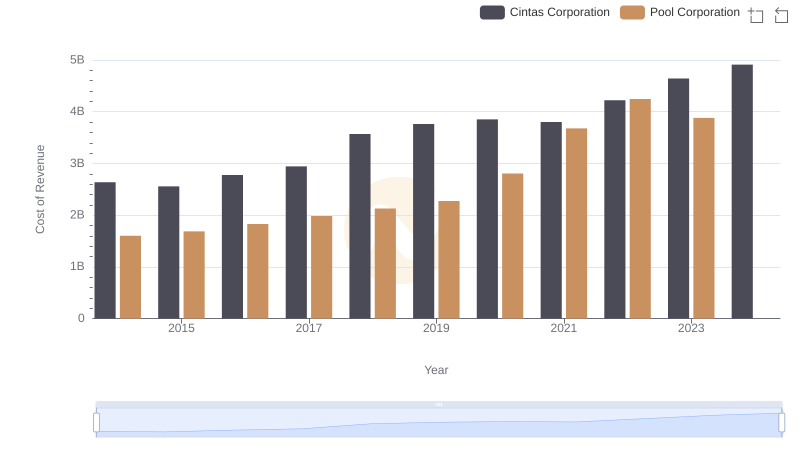
Cost of Revenue: Key Insights for Cintas Corporation and Pool Corporation
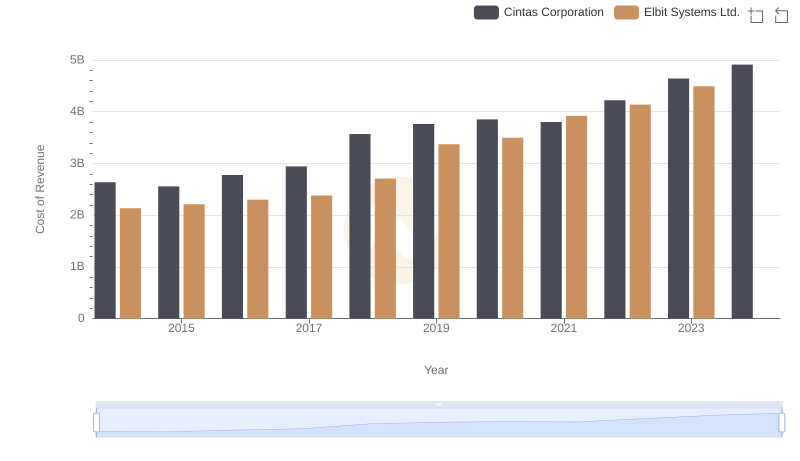
Analyzing Cost of Revenue: Cintas Corporation and Elbit Systems Ltd.
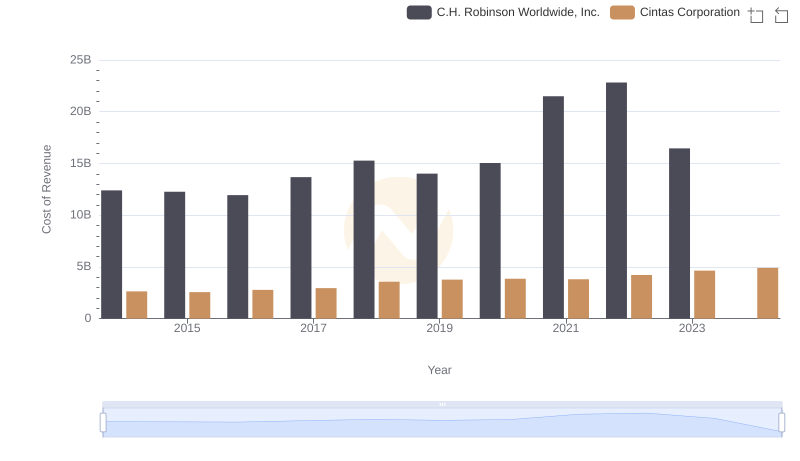
Cost of Revenue Trends: Cintas Corporation vs C.H. Robinson Worldwide, Inc.
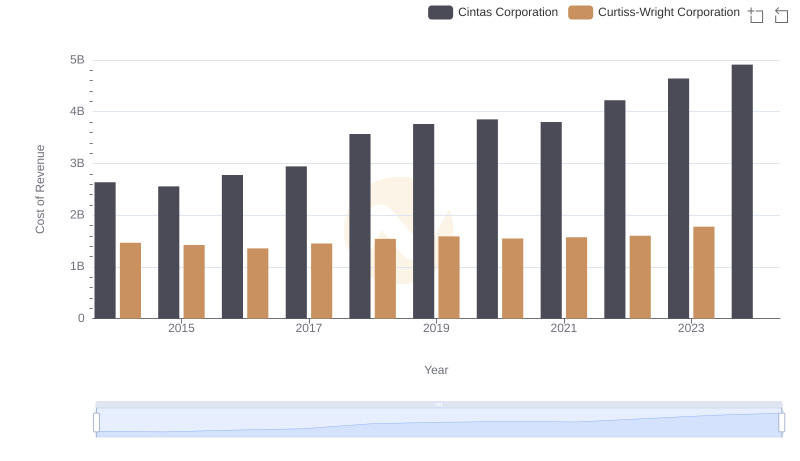
Cost of Revenue Comparison: Cintas Corporation vs Curtiss-Wright Corporation
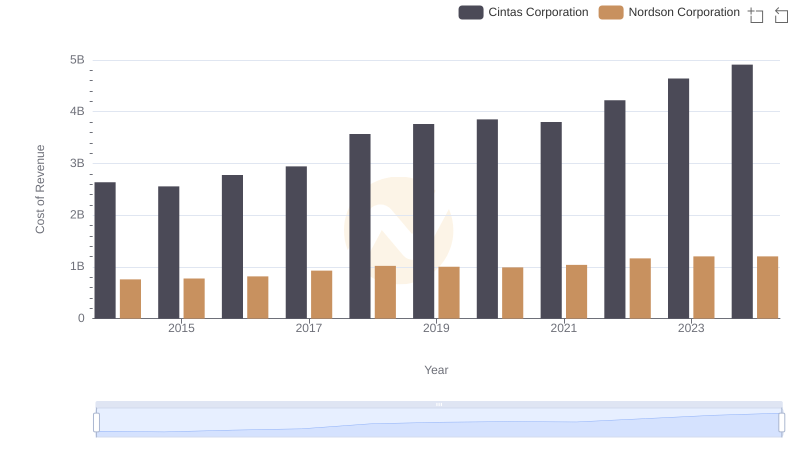
Comparing Cost of Revenue Efficiency: Cintas Corporation vs Nordson Corporation
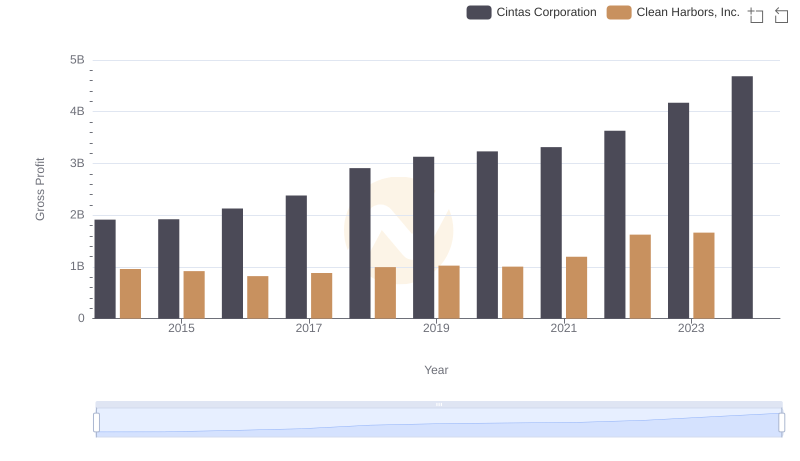
Gross Profit Trends Compared: Cintas Corporation vs Clean Harbors, Inc.