| __timestamp | Cintas Corporation | Saia, Inc. |
|---|---|---|
| Wednesday, January 1, 2014 | 1302752000 | 37563000 |
| Thursday, January 1, 2015 | 1224930000 | 26832000 |
| Friday, January 1, 2016 | 1348122000 | 39625000 |
| Sunday, January 1, 2017 | 1527380000 | 37162000 |
| Monday, January 1, 2018 | 1916792000 | 38425000 |
| Tuesday, January 1, 2019 | 1980644000 | 43073000 |
| Wednesday, January 1, 2020 | 2071052000 | 49761000 |
| Friday, January 1, 2021 | 1929159000 | 61345000 |
| Saturday, January 1, 2022 | 2044876000 | 56601000 |
| Sunday, January 1, 2023 | 2370704000 | 67984000 |
| Monday, January 1, 2024 | 2617783000 |
Unlocking the unknown
In the world of corporate finance, Selling, General, and Administrative (SG&A) expenses are a crucial indicator of a company's operational efficiency. This chart compares the SG&A expenses of Cintas Corporation and Saia, Inc. from 2014 to 2023.
Cintas Corporation has shown a consistent upward trend in SG&A expenses, starting at approximately $1.3 billion in 2014 and reaching nearly $2.4 billion by 2023. This represents an increase of over 80% in a decade, reflecting the company's expansion and increased operational activities.
In contrast, Saia, Inc.'s SG&A expenses have grown from around $37 million in 2014 to about $68 million in 2023, marking an increase of approximately 84%. Despite the smaller scale, this growth indicates Saia's strategic investments in its operations.
The data for 2024 is incomplete, highlighting the dynamic nature of financial forecasting.
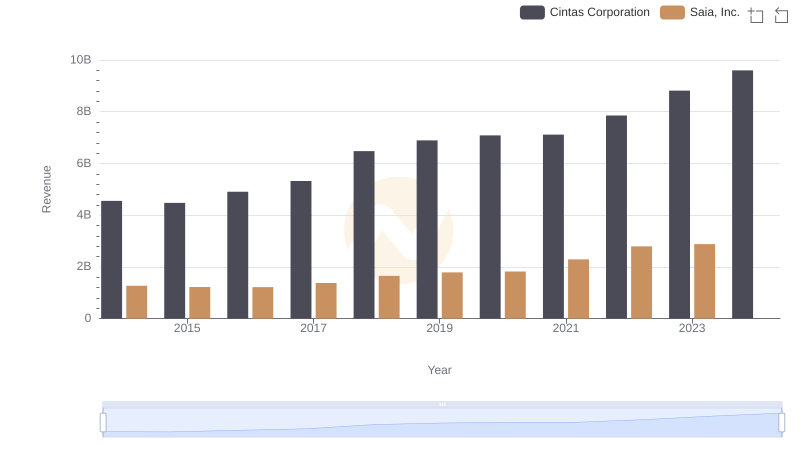
Cintas Corporation vs Saia, Inc.: Examining Key Revenue Metrics
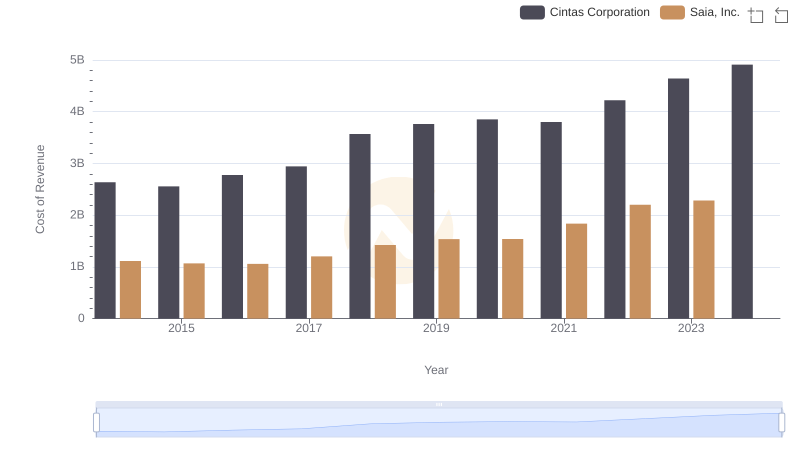
Cost of Revenue Trends: Cintas Corporation vs Saia, Inc.
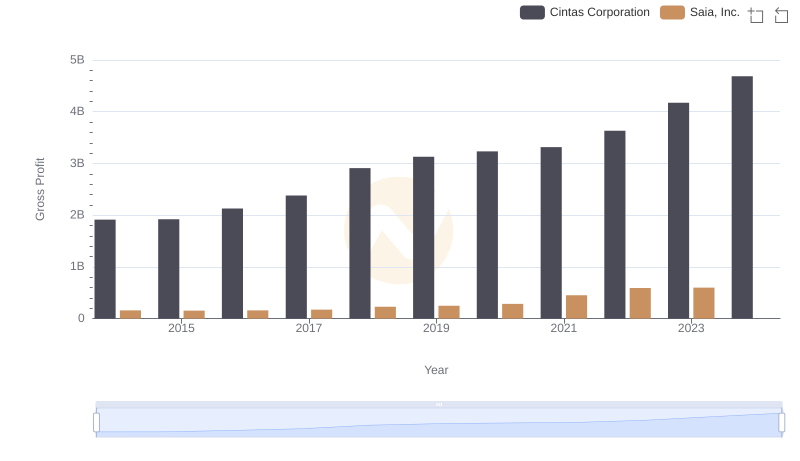
Who Generates Higher Gross Profit? Cintas Corporation or Saia, Inc.
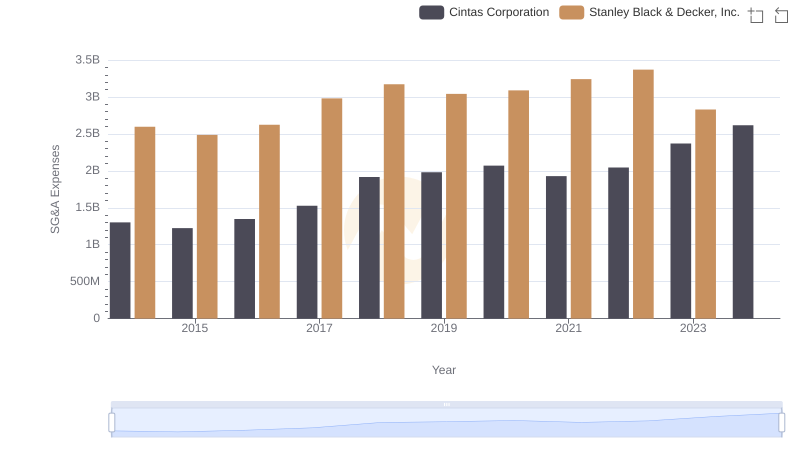
Cintas Corporation or Stanley Black & Decker, Inc.: Who Manages SG&A Costs Better?
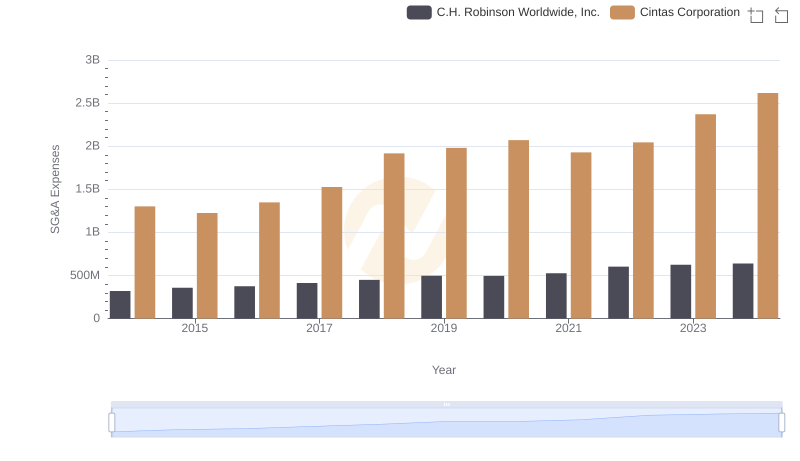
Cintas Corporation or C.H. Robinson Worldwide, Inc.: Who Manages SG&A Costs Better?
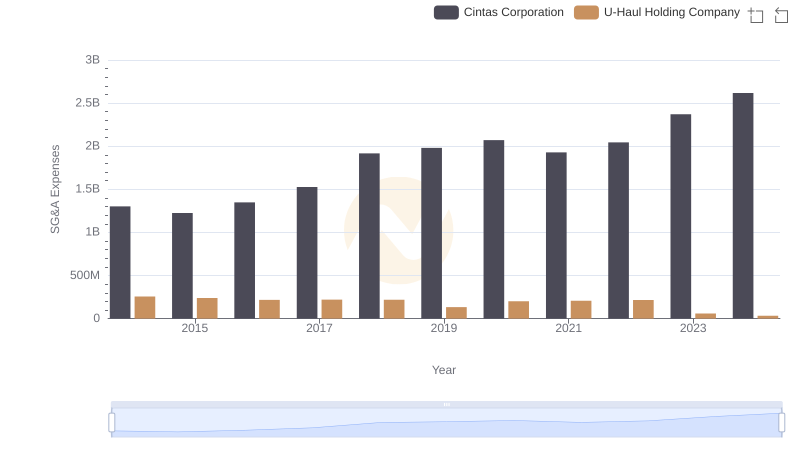
Cintas Corporation vs U-Haul Holding Company: SG&A Expense Trends
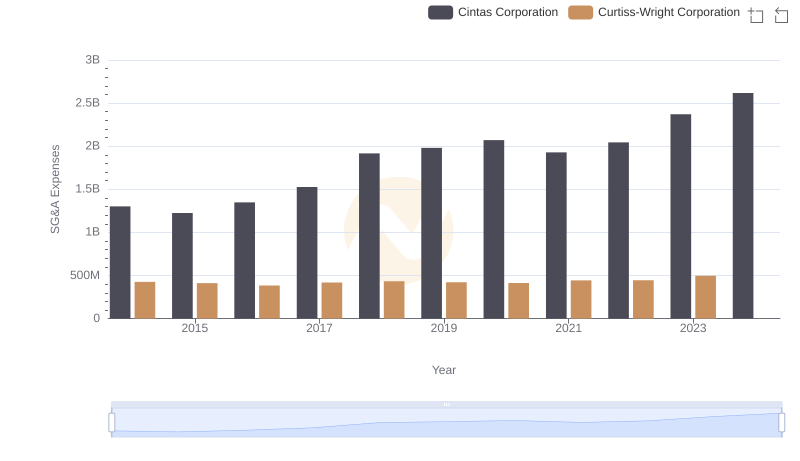
Who Optimizes SG&A Costs Better? Cintas Corporation or Curtiss-Wright Corporation
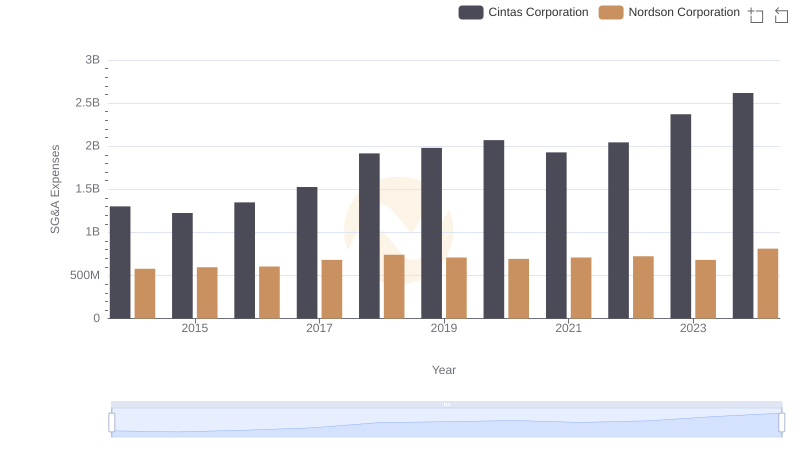
Breaking Down SG&A Expenses: Cintas Corporation vs Nordson Corporation
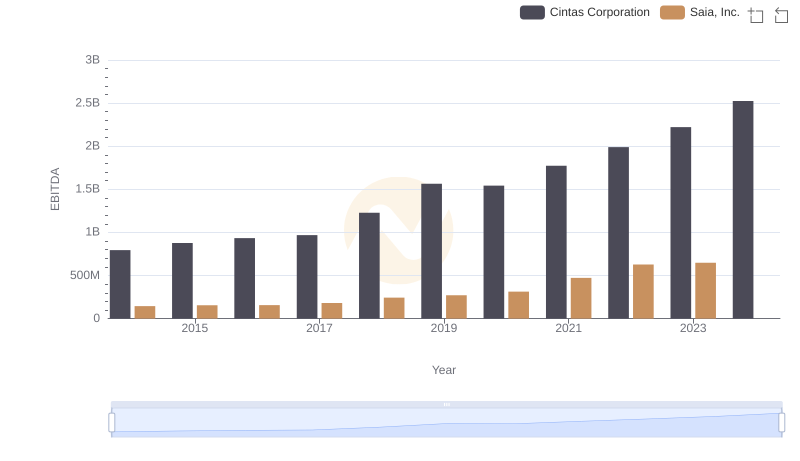
Cintas Corporation and Saia, Inc.: A Detailed Examination of EBITDA Performance