| __timestamp | C.H. Robinson Worldwide, Inc. | Cintas Corporation |
|---|---|---|
| Wednesday, January 1, 2014 | 12401436000 | 2637426000 |
| Thursday, January 1, 2015 | 12259014000 | 2555549000 |
| Friday, January 1, 2016 | 11931821000 | 2775588000 |
| Sunday, January 1, 2017 | 13680857000 | 2943086000 |
| Monday, January 1, 2018 | 15269479000 | 3568109000 |
| Tuesday, January 1, 2019 | 14021726000 | 3763715000 |
| Wednesday, January 1, 2020 | 15037716000 | 3851372000 |
| Friday, January 1, 2021 | 21493659000 | 3801689000 |
| Saturday, January 1, 2022 | 22826428000 | 4222213000 |
| Sunday, January 1, 2023 | 16457570000 | 4642401000 |
| Monday, January 1, 2024 | 16416191000 | 4910199000 |
Igniting the spark of knowledge
In the ever-evolving landscape of the logistics and uniform rental industries, Cintas Corporation and C.H. Robinson Worldwide, Inc. have emerged as key players. Over the past decade, these companies have demonstrated distinct trends in their cost of revenue, reflecting their strategic priorities and market dynamics.
From 2014 to 2023, C.H. Robinson Worldwide, Inc. experienced a significant fluctuation in its cost of revenue, peaking in 2022 with a 64% increase from its 2014 levels. This surge underscores the company's aggressive expansion and adaptation to global supply chain challenges. In contrast, Cintas Corporation has shown a steady upward trajectory, with a 76% rise in cost of revenue over the same period, highlighting its consistent growth and market penetration.
As we look to the future, these trends offer valuable insights into the operational strategies and market positioning of these industry leaders.
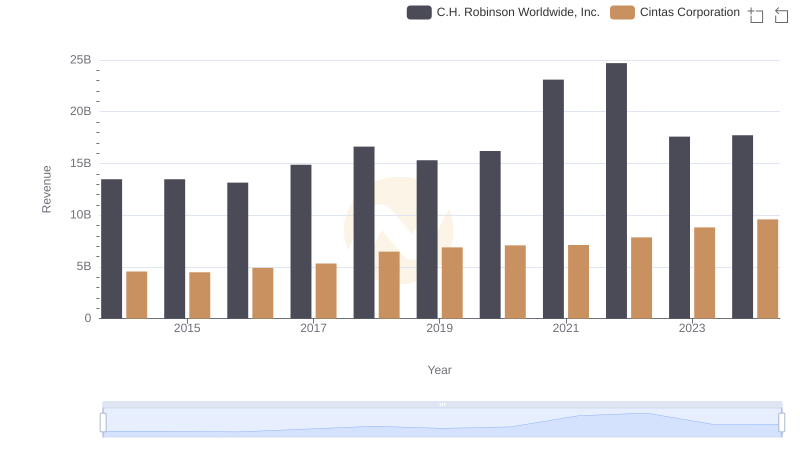
Revenue Showdown: Cintas Corporation vs C.H. Robinson Worldwide, Inc.
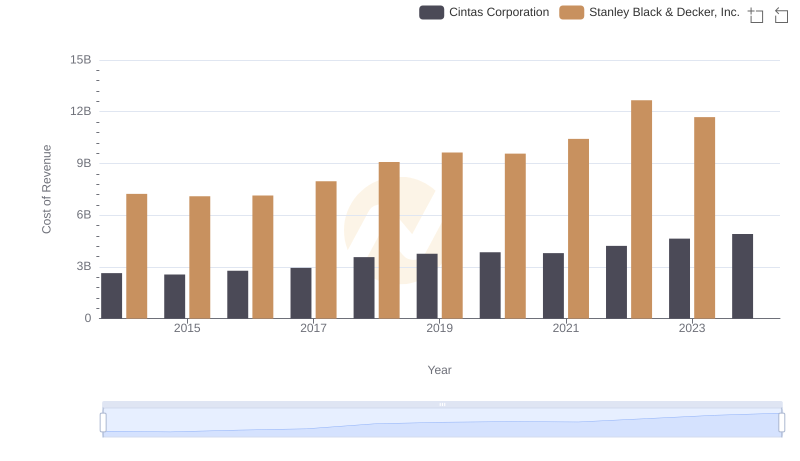
Analyzing Cost of Revenue: Cintas Corporation and Stanley Black & Decker, Inc.
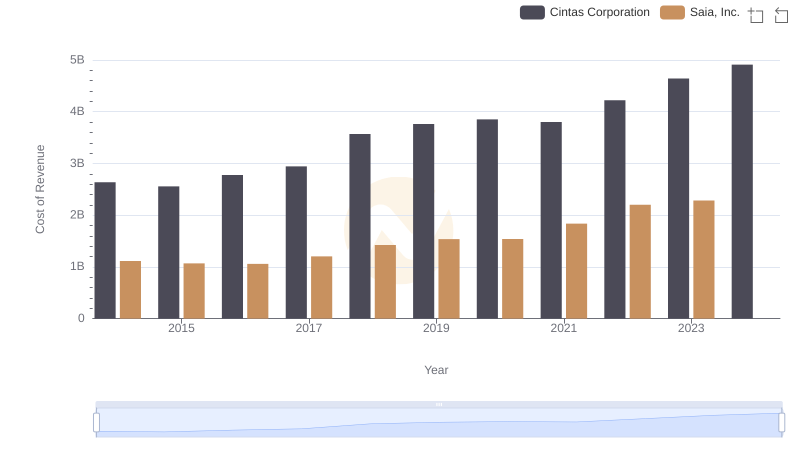
Cost of Revenue Trends: Cintas Corporation vs Saia, Inc.
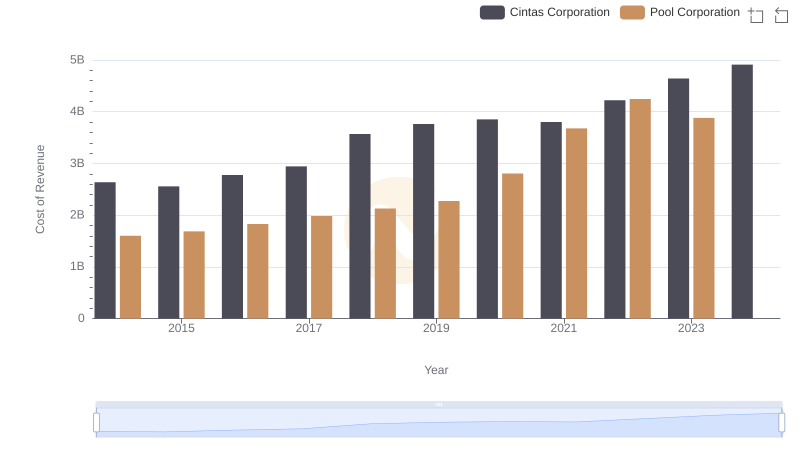
Cost of Revenue: Key Insights for Cintas Corporation and Pool Corporation
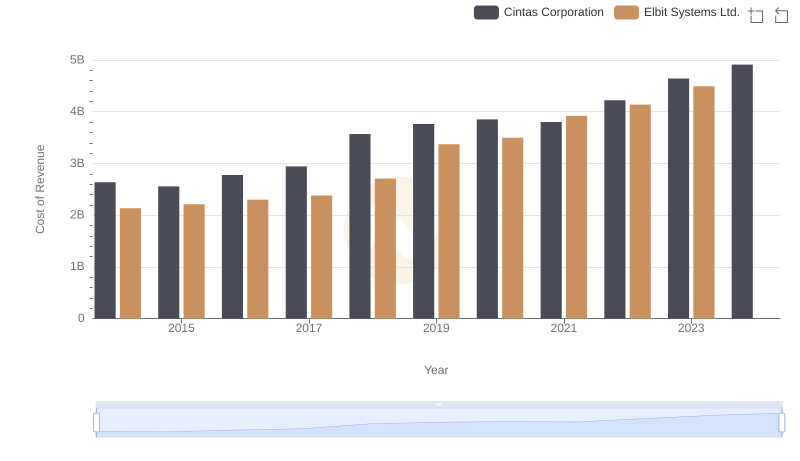
Analyzing Cost of Revenue: Cintas Corporation and Elbit Systems Ltd.
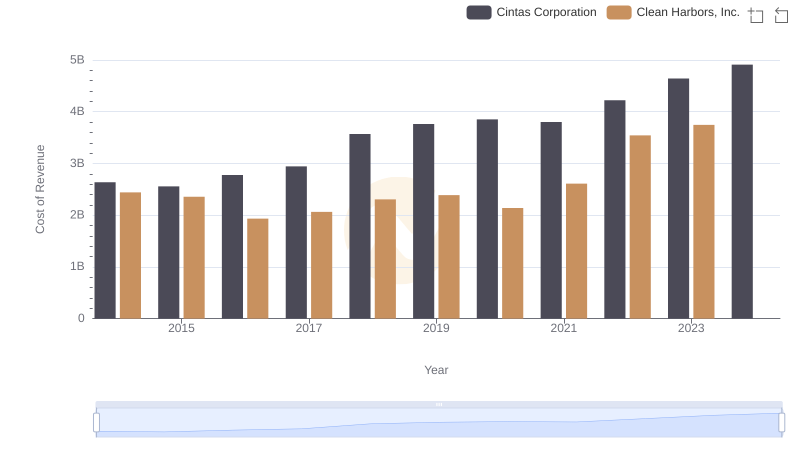
Analyzing Cost of Revenue: Cintas Corporation and Clean Harbors, Inc.
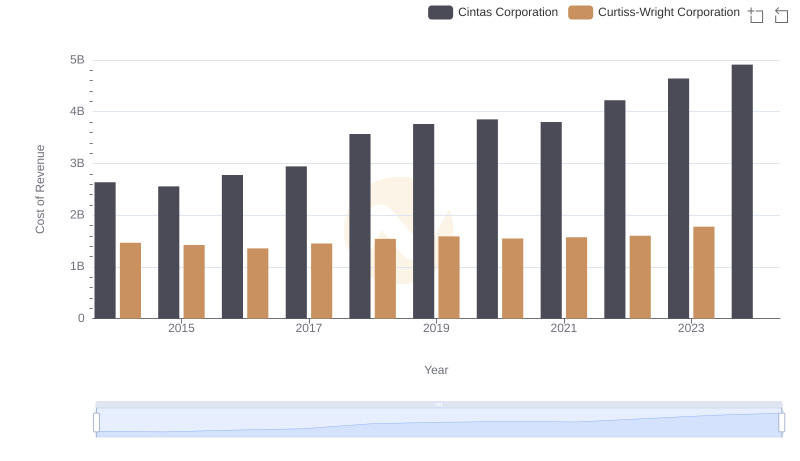
Cost of Revenue Comparison: Cintas Corporation vs Curtiss-Wright Corporation
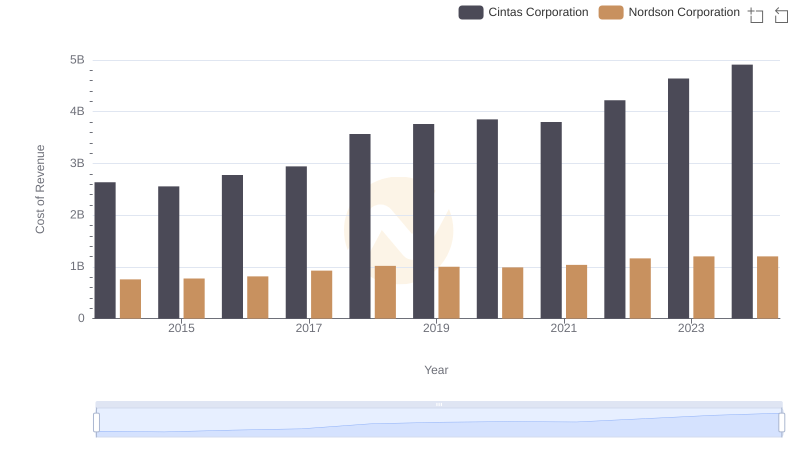
Comparing Cost of Revenue Efficiency: Cintas Corporation vs Nordson Corporation
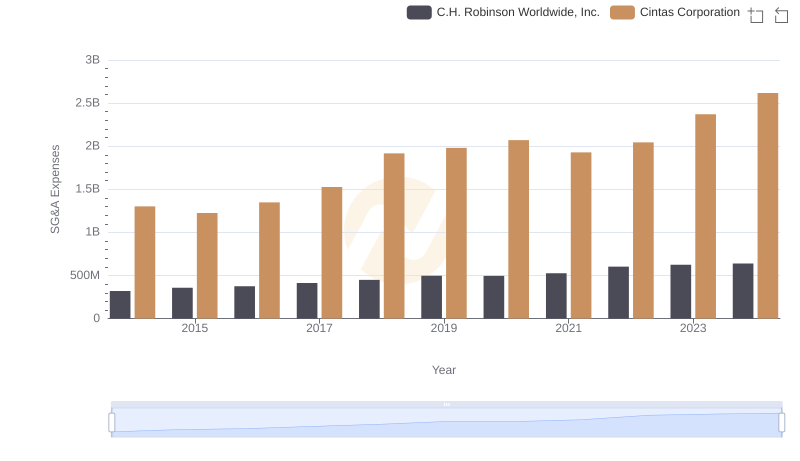
Cintas Corporation or C.H. Robinson Worldwide, Inc.: Who Manages SG&A Costs Better?