| __timestamp | Stanley Black & Decker, Inc. | Waste Connections, Inc. |
|---|---|---|
| Wednesday, January 1, 2014 | 7235900000 | 1138388000 |
| Thursday, January 1, 2015 | 7099800000 | 1177409000 |
| Friday, January 1, 2016 | 7139700000 | 1957712000 |
| Sunday, January 1, 2017 | 7969200000 | 2704775000 |
| Monday, January 1, 2018 | 9080500000 | 2865704000 |
| Tuesday, January 1, 2019 | 9636700000 | 3198757000 |
| Wednesday, January 1, 2020 | 9566700000 | 3276808000 |
| Friday, January 1, 2021 | 10423000000 | 3654074000 |
| Saturday, January 1, 2022 | 12663300000 | 4336012000 |
| Sunday, January 1, 2023 | 11683100000 | 4744513000 |
| Monday, January 1, 2024 | 10851300000 | 5191706000 |
Data in motion
In the ever-evolving landscape of corporate finance, understanding cost structures is pivotal. This analysis delves into the cost of revenue trends for Waste Connections, Inc. and Stanley Black & Decker, Inc. from 2014 to 2023. Over this period, Stanley Black & Decker, Inc. witnessed a 61% increase in its cost of revenue, peaking in 2022. Meanwhile, Waste Connections, Inc. saw a remarkable 317% rise, reflecting its aggressive growth strategy.
These insights offer a window into the strategic financial maneuvers of these industry giants, highlighting their adaptability and growth trajectories.
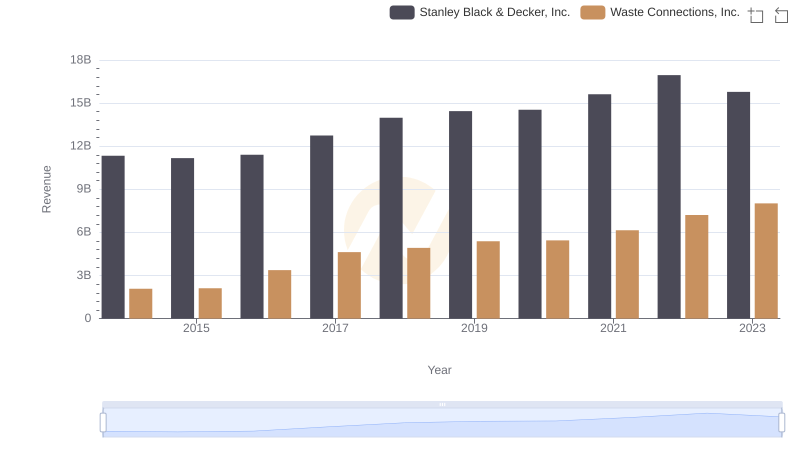
Comparing Revenue Performance: Waste Connections, Inc. or Stanley Black & Decker, Inc.?

Who Generates Higher Gross Profit? Waste Connections, Inc. or Stanley Black & Decker, Inc.
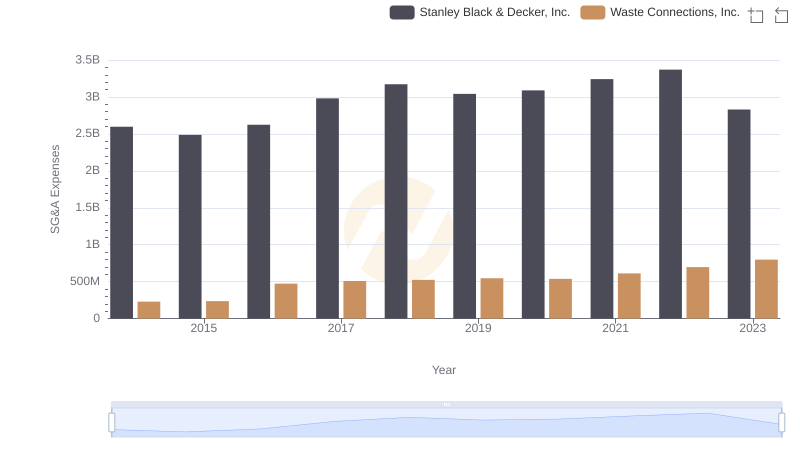
Breaking Down SG&A Expenses: Waste Connections, Inc. vs Stanley Black & Decker, Inc.
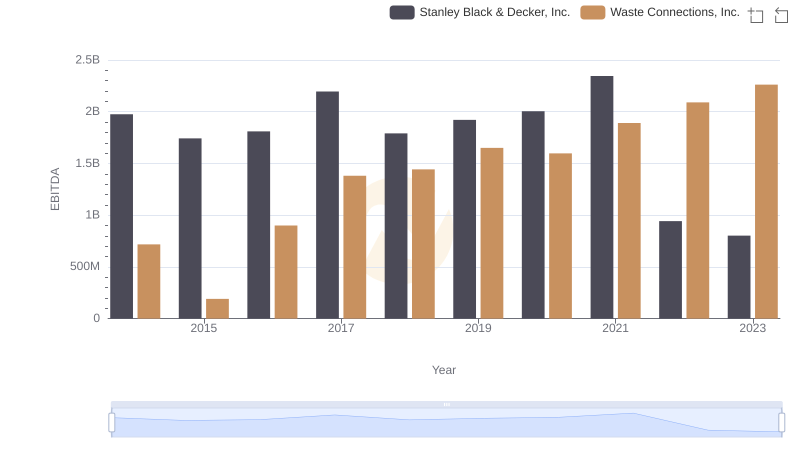
A Professional Review of EBITDA: Waste Connections, Inc. Compared to Stanley Black & Decker, Inc.
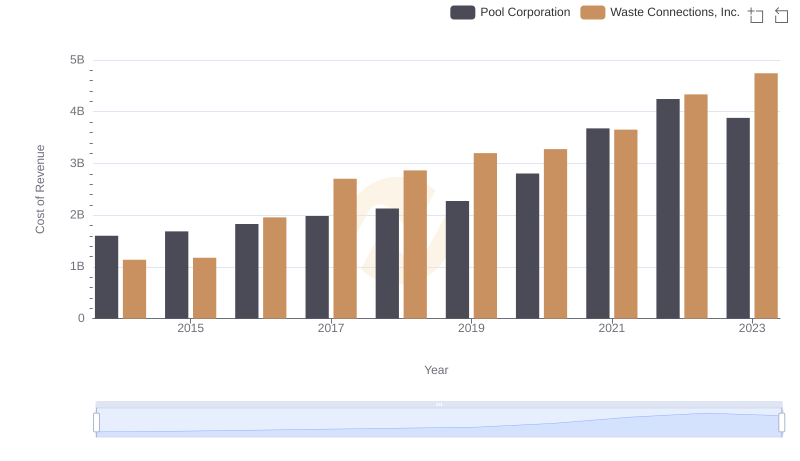
Waste Connections, Inc. vs Pool Corporation: Efficiency in Cost of Revenue Explored
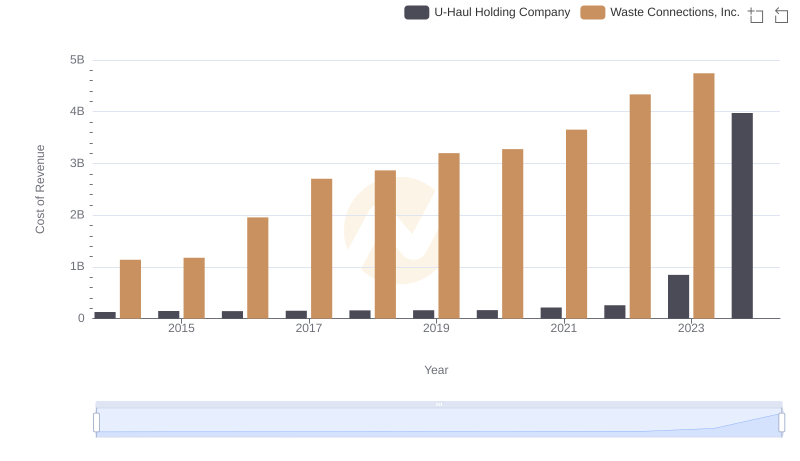
Cost of Revenue Trends: Waste Connections, Inc. vs U-Haul Holding Company
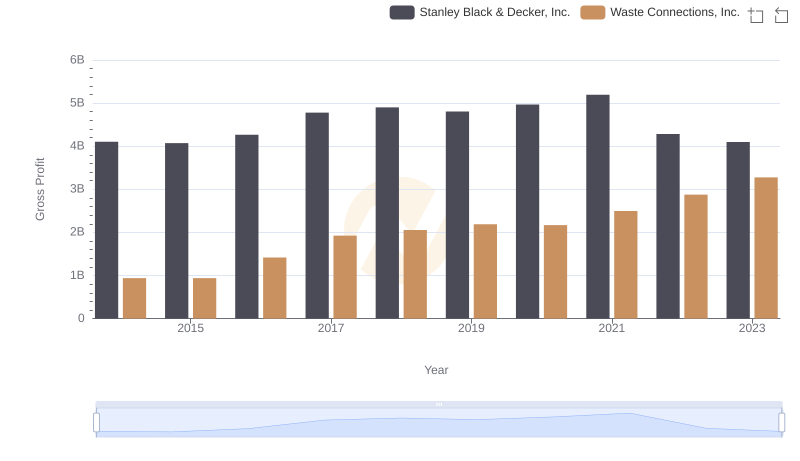
Gross Profit Analysis: Comparing Waste Connections, Inc. and Stanley Black & Decker, Inc.

Professional EBITDA Benchmarking: Waste Connections, Inc. vs Stanley Black & Decker, Inc.