| __timestamp | Saia, Inc. | Waste Connections, Inc. |
|---|---|---|
| Wednesday, January 1, 2014 | 1113053000 | 1138388000 |
| Thursday, January 1, 2015 | 1067191000 | 1177409000 |
| Friday, January 1, 2016 | 1058979000 | 1957712000 |
| Sunday, January 1, 2017 | 1203464000 | 2704775000 |
| Monday, January 1, 2018 | 1423779000 | 2865704000 |
| Tuesday, January 1, 2019 | 1537082000 | 3198757000 |
| Wednesday, January 1, 2020 | 1538518000 | 3276808000 |
| Friday, January 1, 2021 | 1837017000 | 3654074000 |
| Saturday, January 1, 2022 | 2201094000 | 4336012000 |
| Sunday, January 1, 2023 | 2282501000 | 4744513000 |
| Monday, January 1, 2024 | 5191706000 |
Unveiling the hidden dimensions of data
In the ever-evolving landscape of corporate finance, understanding cost structures is pivotal. Over the past decade, Waste Connections, Inc. and Saia, Inc. have demonstrated intriguing trends in their cost of revenue. From 2014 to 2023, Waste Connections, Inc. saw a remarkable 316% increase in costs, peaking at approximately $4.7 billion in 2023. Meanwhile, Saia, Inc. experienced a 105% rise, reaching around $2.3 billion in the same year.
While both companies have shown growth, Waste Connections, Inc.'s cost of revenue consistently outpaced Saia, Inc.'s by a factor of nearly 2:1. This disparity highlights differing operational scales and strategies. The data suggests that Waste Connections, Inc. has been expanding its operations more aggressively, possibly investing in infrastructure or scaling its services.
As we look to the future, these trends offer valuable insights for investors and stakeholders. Understanding these cost dynamics can inform strategic decisions and highlight potential areas for efficiency improvements.
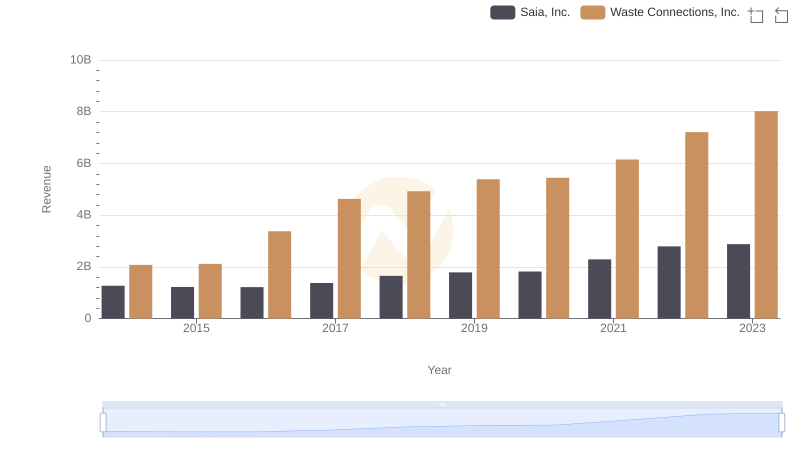
Comparing Revenue Performance: Waste Connections, Inc. or Saia, Inc.?
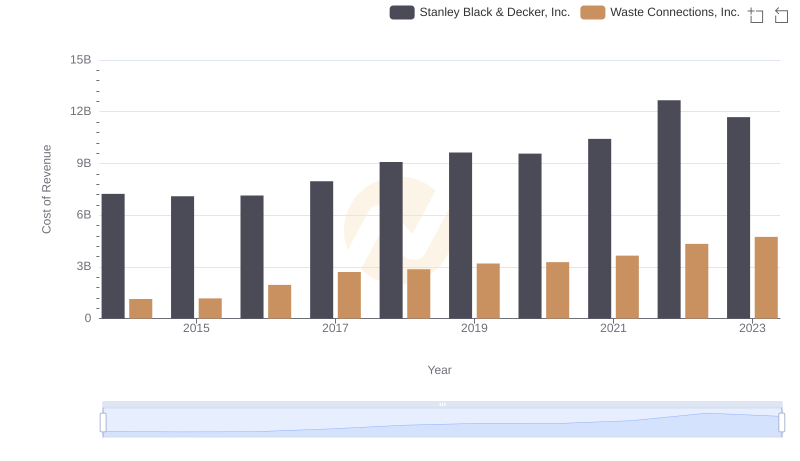
Cost Insights: Breaking Down Waste Connections, Inc. and Stanley Black & Decker, Inc.'s Expenses
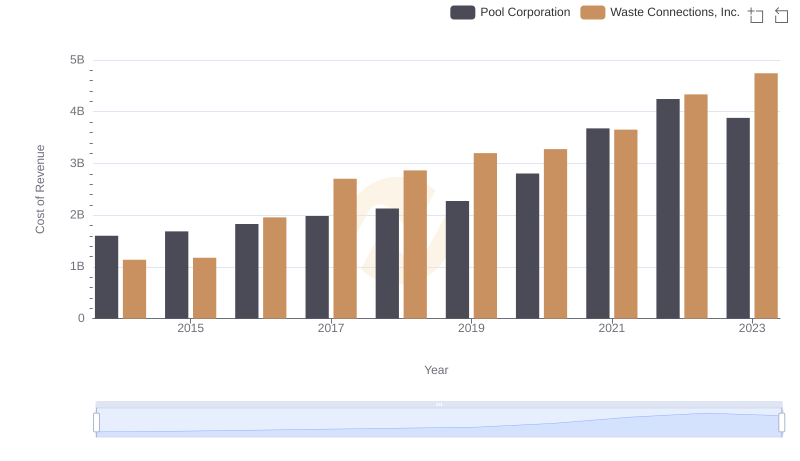
Waste Connections, Inc. vs Pool Corporation: Efficiency in Cost of Revenue Explored
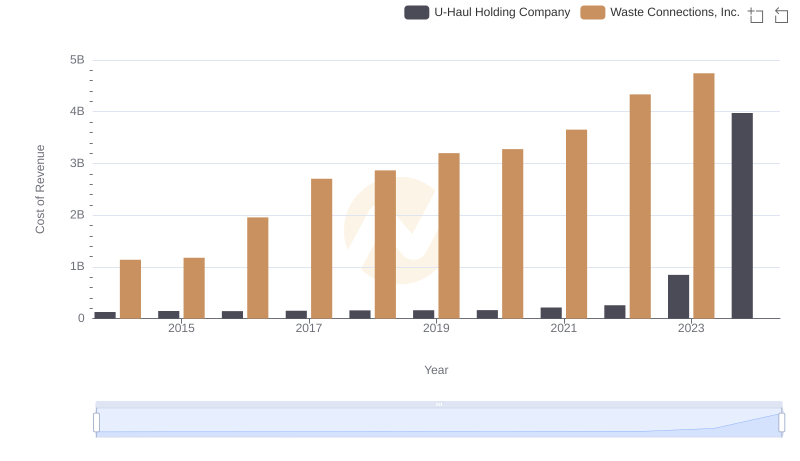
Cost of Revenue Trends: Waste Connections, Inc. vs U-Haul Holding Company
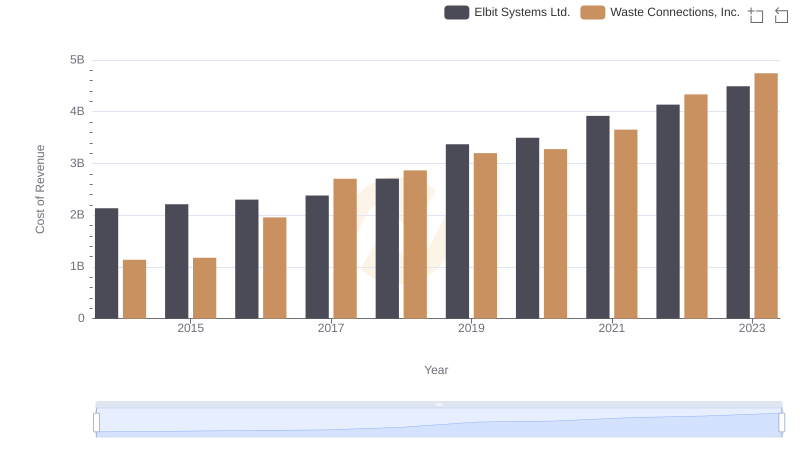
Cost of Revenue Trends: Waste Connections, Inc. vs Elbit Systems Ltd.
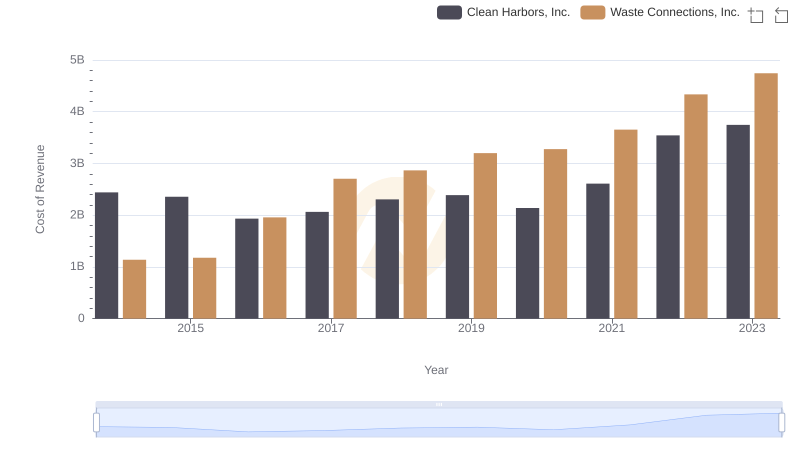
Waste Connections, Inc. vs Clean Harbors, Inc.: Efficiency in Cost of Revenue Explored
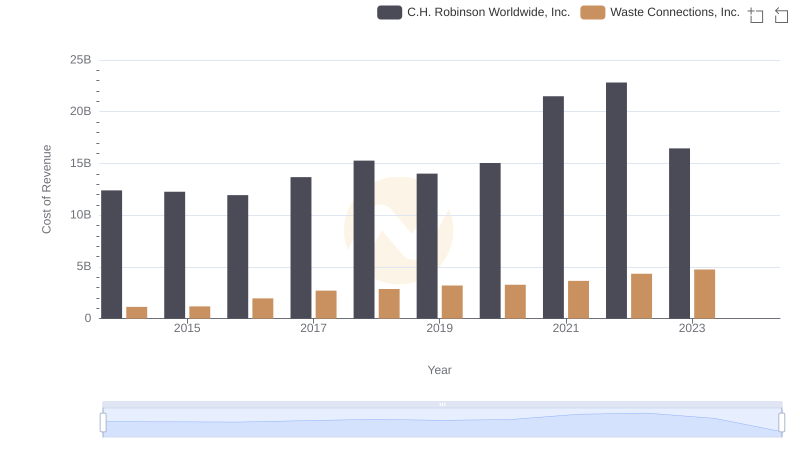
Analyzing Cost of Revenue: Waste Connections, Inc. and C.H. Robinson Worldwide, Inc.
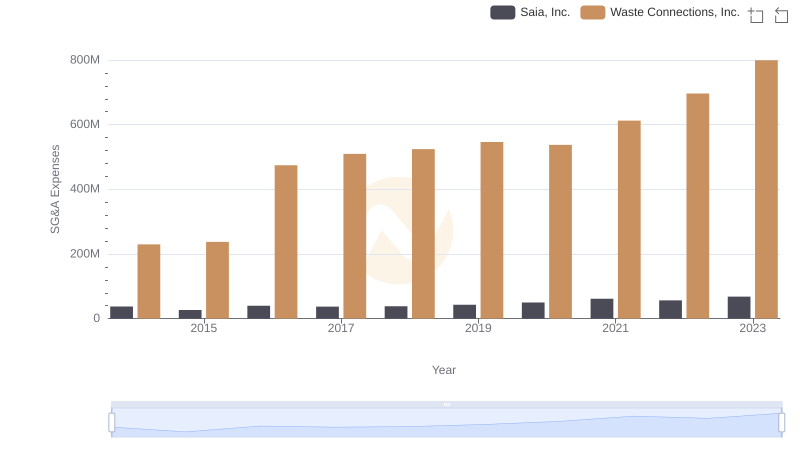
SG&A Efficiency Analysis: Comparing Waste Connections, Inc. and Saia, Inc.
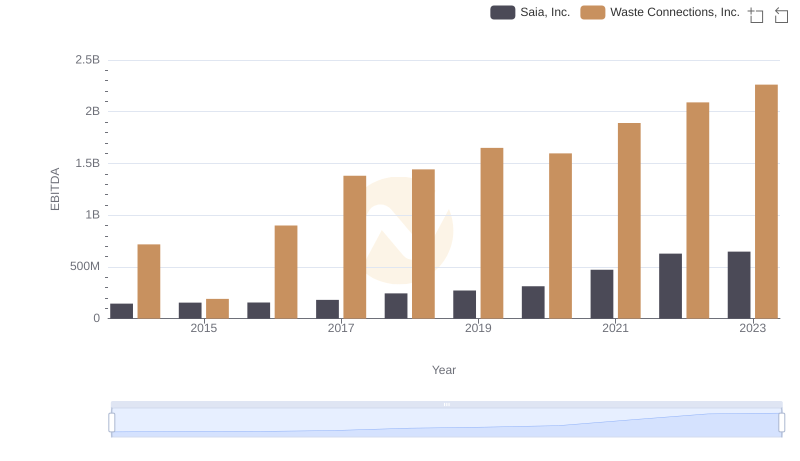
EBITDA Performance Review: Waste Connections, Inc. vs Saia, Inc.