| __timestamp | Comfort Systems USA, Inc. | Waste Connections, Inc. |
|---|---|---|
| Wednesday, January 1, 2014 | 1161024000 | 1138388000 |
| Thursday, January 1, 2015 | 1262390000 | 1177409000 |
| Friday, January 1, 2016 | 1290331000 | 1957712000 |
| Sunday, January 1, 2017 | 1421641000 | 2704775000 |
| Monday, January 1, 2018 | 1736600000 | 2865704000 |
| Tuesday, January 1, 2019 | 2113334000 | 3198757000 |
| Wednesday, January 1, 2020 | 2309676000 | 3276808000 |
| Friday, January 1, 2021 | 2510429000 | 3654074000 |
| Saturday, January 1, 2022 | 3398756000 | 4336012000 |
| Sunday, January 1, 2023 | 4216251000 | 4744513000 |
| Monday, January 1, 2024 | 5191706000 |
Unleashing the power of data
In the ever-evolving landscape of American business, Waste Connections, Inc. and Comfort Systems USA, Inc. have emerged as key players in their respective industries. Over the past decade, from 2014 to 2023, these companies have shown remarkable growth in their cost of revenue, a critical metric that reflects the direct costs attributable to the production of goods sold by a company.
Waste Connections, Inc., a leader in waste management, has seen its cost of revenue soar by approximately 316% over this period, reaching its peak in 2023. Comfort Systems USA, Inc., a prominent player in the mechanical services industry, has also experienced a significant increase of around 263% in the same timeframe.
This upward trend highlights the expanding operational scale and market demand faced by both companies. As they continue to grow, understanding these cost dynamics becomes crucial for investors and industry analysts alike.
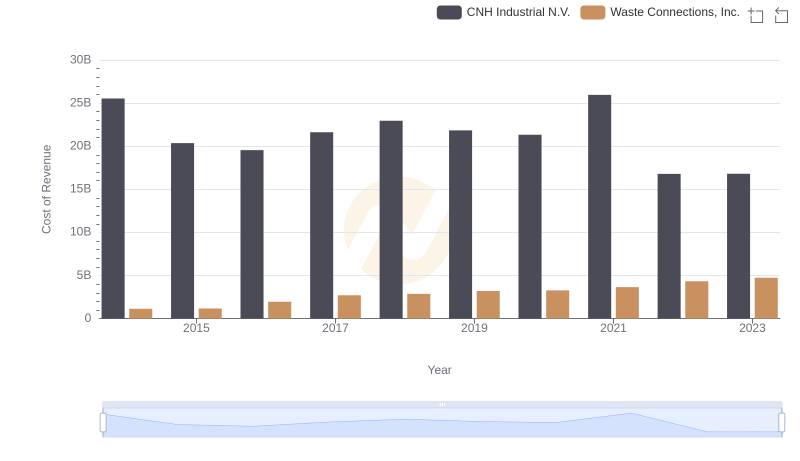
Cost Insights: Breaking Down Waste Connections, Inc. and CNH Industrial N.V.'s Expenses
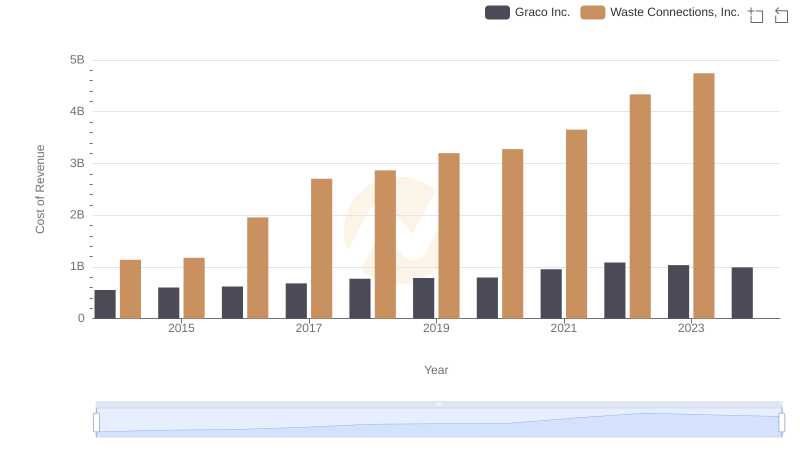
Cost of Revenue: Key Insights for Waste Connections, Inc. and Graco Inc.
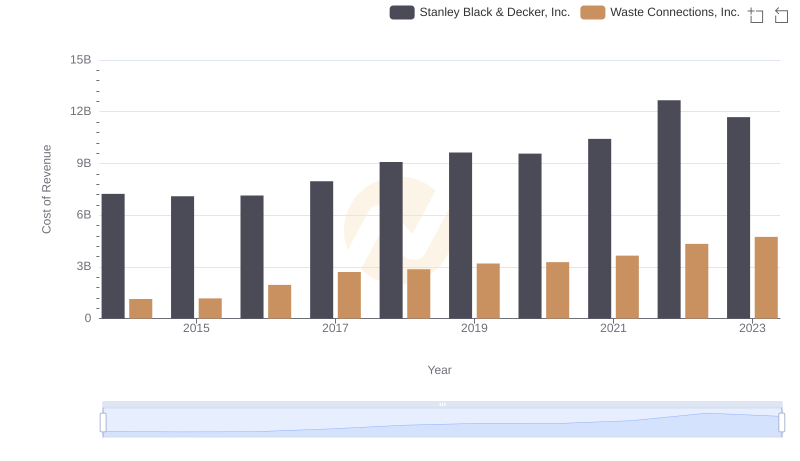
Cost Insights: Breaking Down Waste Connections, Inc. and Stanley Black & Decker, Inc.'s Expenses
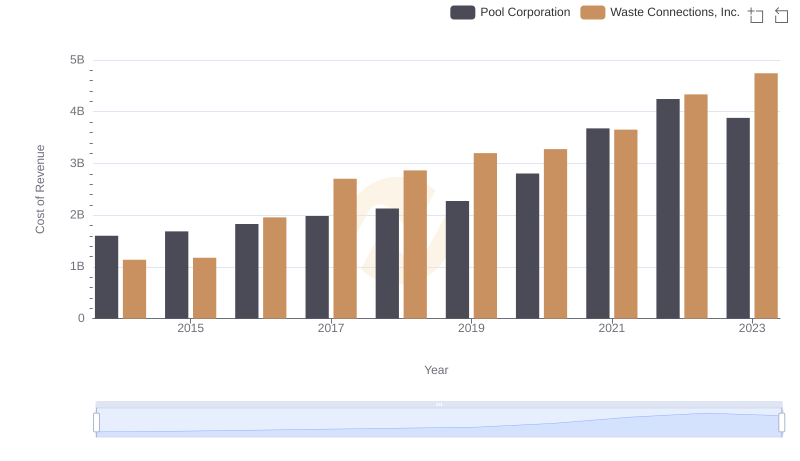
Waste Connections, Inc. vs Pool Corporation: Efficiency in Cost of Revenue Explored
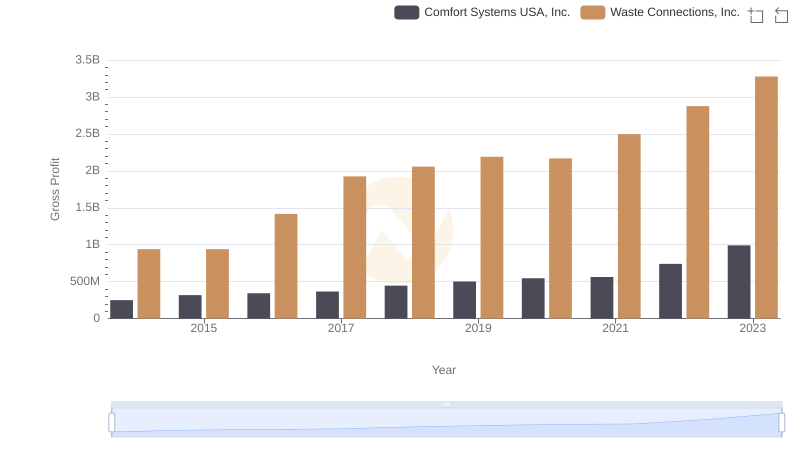
Gross Profit Trends Compared: Waste Connections, Inc. vs Comfort Systems USA, Inc.
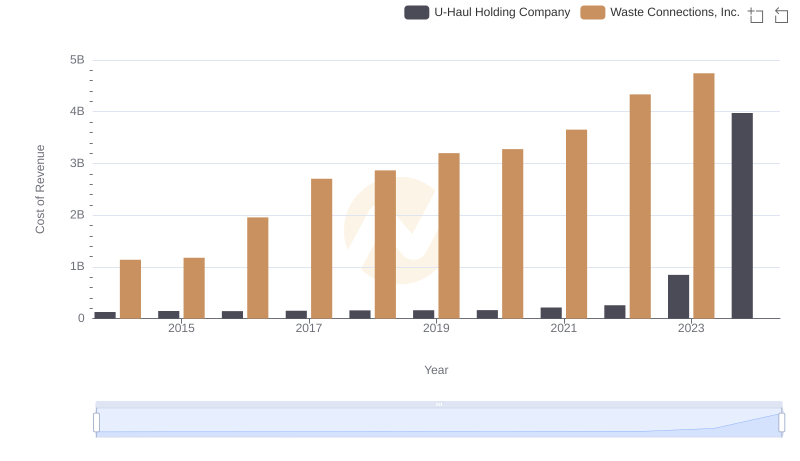
Cost of Revenue Trends: Waste Connections, Inc. vs U-Haul Holding Company
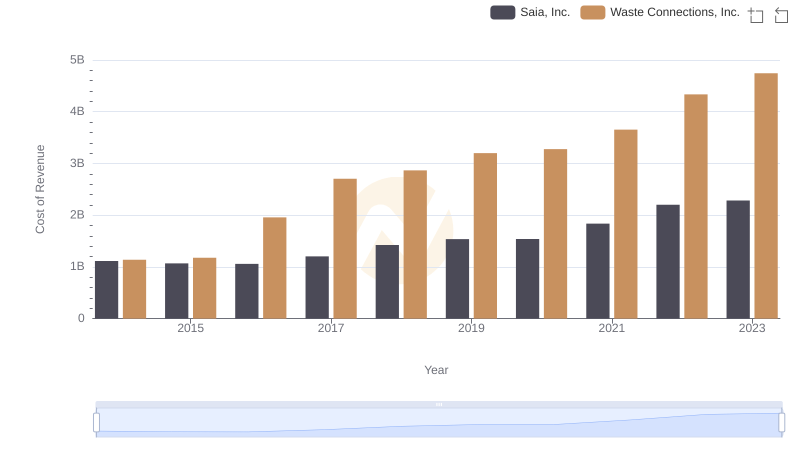
Cost Insights: Breaking Down Waste Connections, Inc. and Saia, Inc.'s Expenses
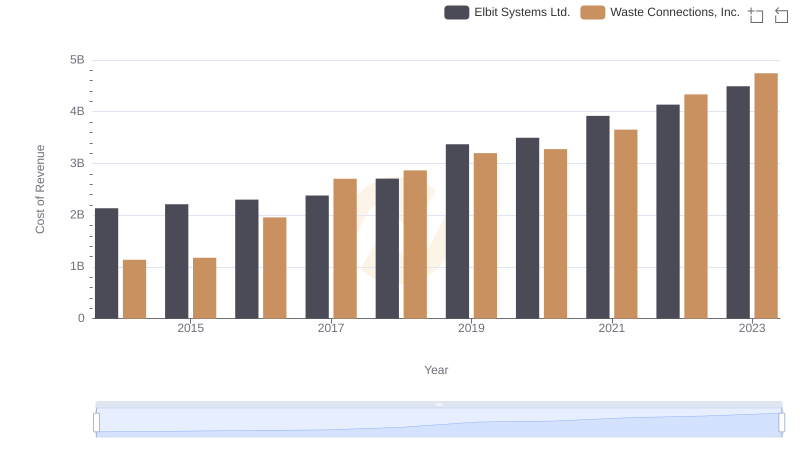
Cost of Revenue Trends: Waste Connections, Inc. vs Elbit Systems Ltd.
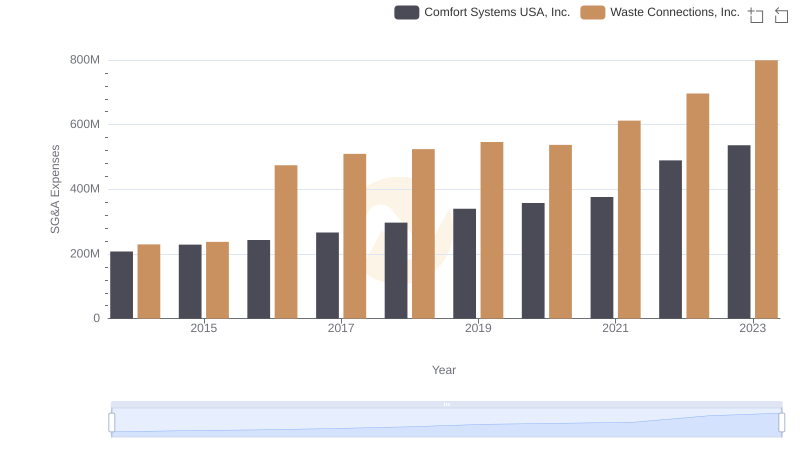
Operational Costs Compared: SG&A Analysis of Waste Connections, Inc. and Comfort Systems USA, Inc.
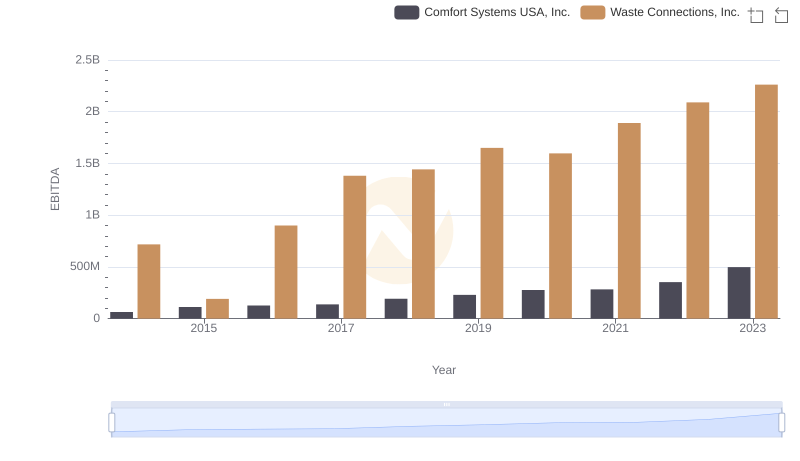
Waste Connections, Inc. vs Comfort Systems USA, Inc.: In-Depth EBITDA Performance Comparison