| __timestamp | Elbit Systems Ltd. | Rockwell Automation, Inc. |
|---|---|---|
| Wednesday, January 1, 2014 | 2133151000 | 3869600000 |
| Thursday, January 1, 2015 | 2210528000 | 3604800000 |
| Friday, January 1, 2016 | 2300636000 | 3404000000 |
| Sunday, January 1, 2017 | 2379905000 | 3687100000 |
| Monday, January 1, 2018 | 2707505000 | 3793800000 |
| Tuesday, January 1, 2019 | 3371933000 | 3794700000 |
| Wednesday, January 1, 2020 | 3497465000 | 3734600000 |
| Friday, January 1, 2021 | 3920473000 | 4099700000 |
| Saturday, January 1, 2022 | 4138266000 | 4658400000 |
| Sunday, January 1, 2023 | 4491790000 | 5341000000 |
| Monday, January 1, 2024 | 5070800000 |
Unleashing the power of data
In the ever-evolving landscape of industrial automation and defense technology, understanding cost structures is crucial. Rockwell Automation, Inc. and Elbit Systems Ltd. have shown distinct trends in their cost of revenue over the past decade. From 2014 to 2023, Rockwell Automation's costs have surged by approximately 38%, peaking in 2023. Meanwhile, Elbit Systems experienced a 110% increase, reflecting its expanding operations and market reach.
These insights provide a window into the financial strategies of these industry giants, highlighting their adaptive approaches in a competitive market.
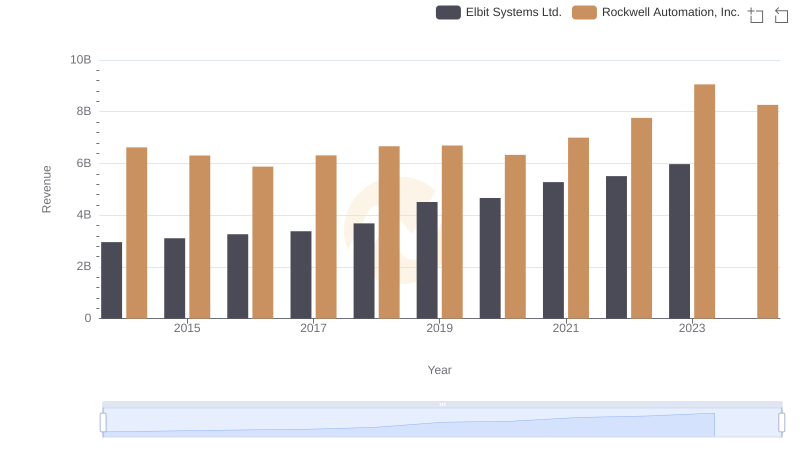
Revenue Showdown: Rockwell Automation, Inc. vs Elbit Systems Ltd.
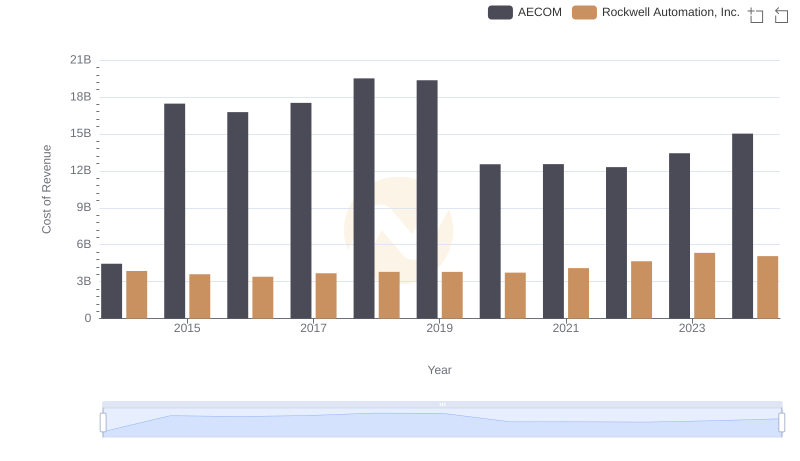
Cost of Revenue: Key Insights for Rockwell Automation, Inc. and AECOM
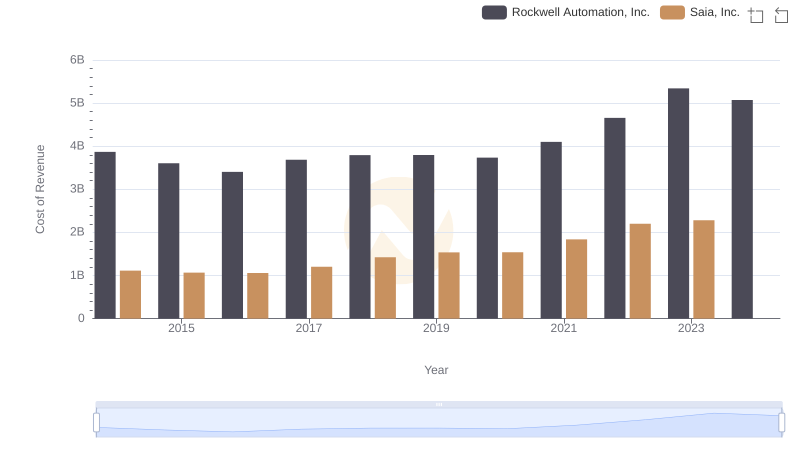
Cost of Revenue Comparison: Rockwell Automation, Inc. vs Saia, Inc.
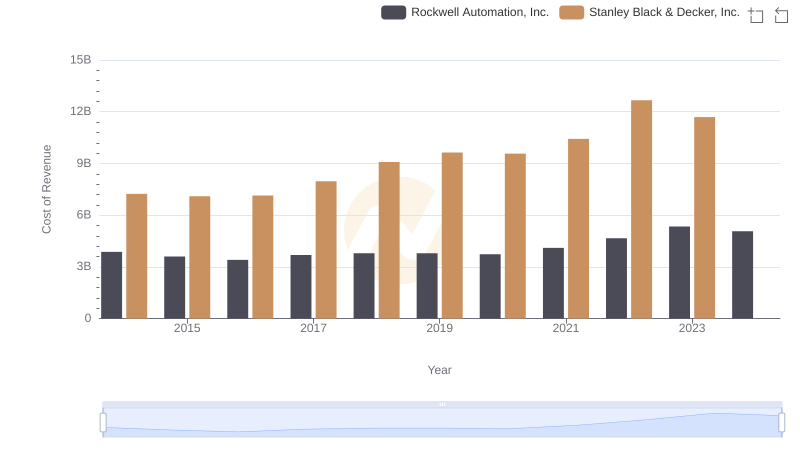
Rockwell Automation, Inc. vs Stanley Black & Decker, Inc.: Efficiency in Cost of Revenue Explored
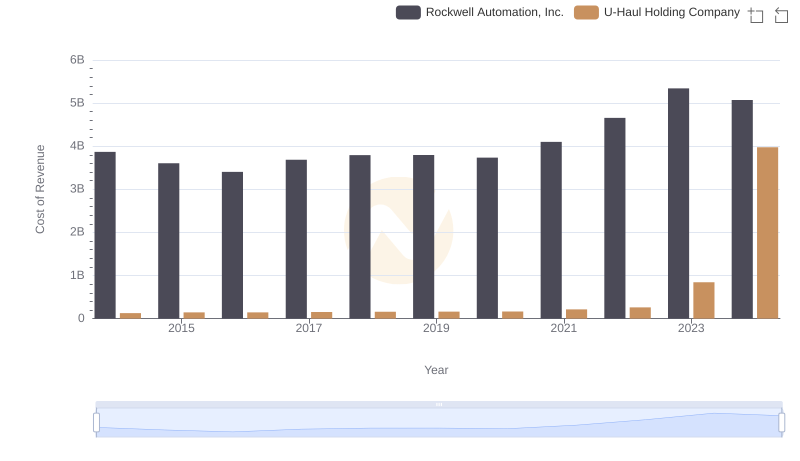
Analyzing Cost of Revenue: Rockwell Automation, Inc. and U-Haul Holding Company
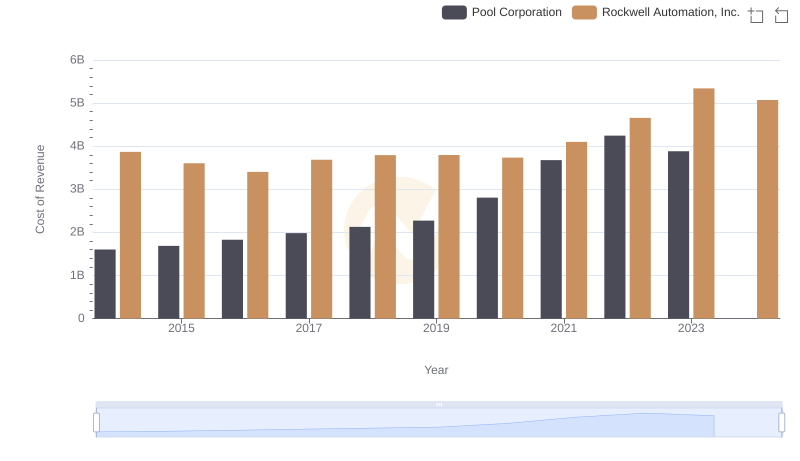
Analyzing Cost of Revenue: Rockwell Automation, Inc. and Pool Corporation
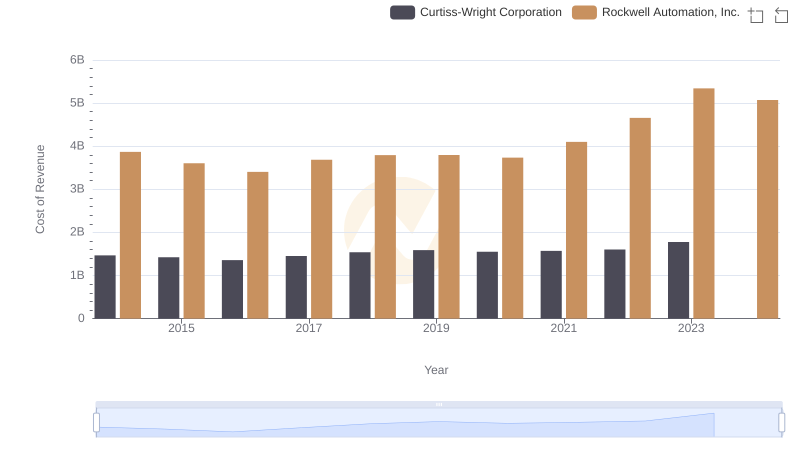
Cost of Revenue Trends: Rockwell Automation, Inc. vs Curtiss-Wright Corporation
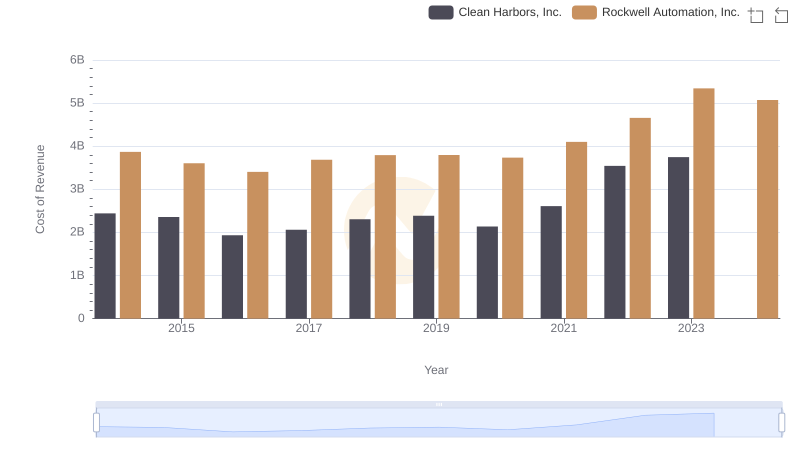
Comparing Cost of Revenue Efficiency: Rockwell Automation, Inc. vs Clean Harbors, Inc.
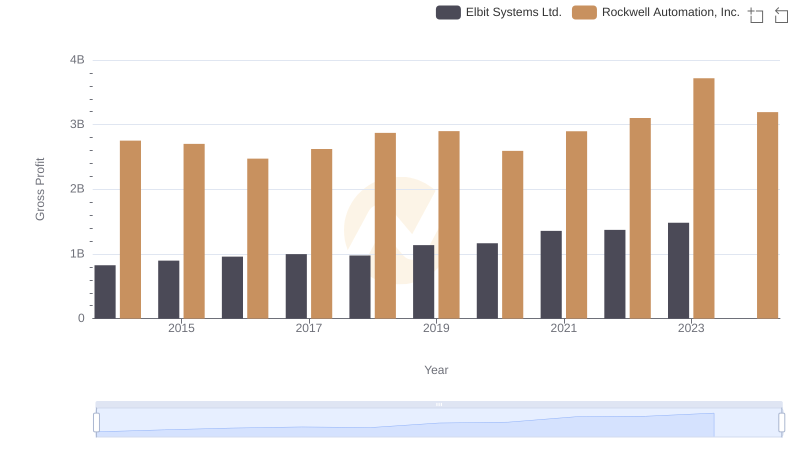
Rockwell Automation, Inc. vs Elbit Systems Ltd.: A Gross Profit Performance Breakdown
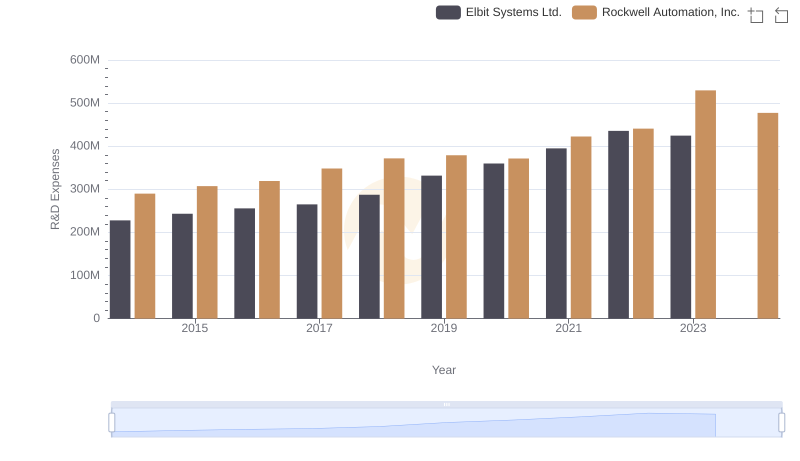
Research and Development Expenses Breakdown: Rockwell Automation, Inc. vs Elbit Systems Ltd.
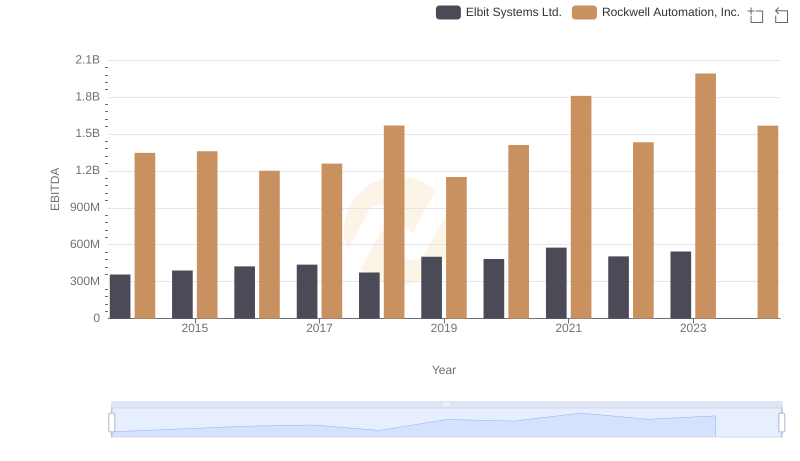
EBITDA Performance Review: Rockwell Automation, Inc. vs Elbit Systems Ltd.