| __timestamp | Rockwell Automation, Inc. | Saia, Inc. |
|---|---|---|
| Wednesday, January 1, 2014 | 3869600000 | 1113053000 |
| Thursday, January 1, 2015 | 3604800000 | 1067191000 |
| Friday, January 1, 2016 | 3404000000 | 1058979000 |
| Sunday, January 1, 2017 | 3687100000 | 1203464000 |
| Monday, January 1, 2018 | 3793800000 | 1423779000 |
| Tuesday, January 1, 2019 | 3794700000 | 1537082000 |
| Wednesday, January 1, 2020 | 3734600000 | 1538518000 |
| Friday, January 1, 2021 | 4099700000 | 1837017000 |
| Saturday, January 1, 2022 | 4658400000 | 2201094000 |
| Sunday, January 1, 2023 | 5341000000 | 2282501000 |
| Monday, January 1, 2024 | 5070800000 |
In pursuit of knowledge
In the ever-evolving landscape of industrial automation and logistics, Rockwell Automation, Inc. and Saia, Inc. have carved distinct paths. From 2014 to 2023, Rockwell Automation's cost of revenue surged by approximately 38%, reflecting its robust growth and strategic investments. In contrast, Saia, Inc. experienced a remarkable 105% increase in the same period, underscoring its aggressive expansion in the logistics sector.
Rockwell Automation's cost of revenue peaked in 2023, while Saia, Inc. showed consistent growth until 2023, with data for 2024 yet to be revealed. This comparison highlights the dynamic nature of these industries, where strategic decisions and market demands shape financial outcomes. As we await 2024 data, the narrative of these two companies continues to unfold, offering insights into their future trajectories.

Revenue Showdown: Rockwell Automation, Inc. vs Saia, Inc.
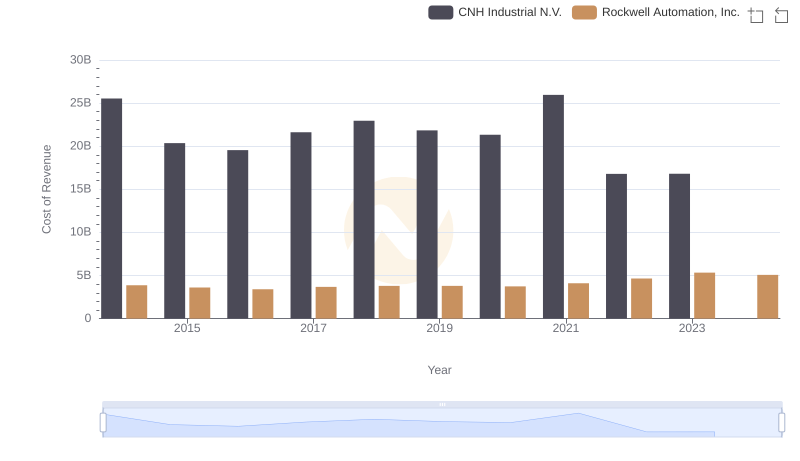
Comparing Cost of Revenue Efficiency: Rockwell Automation, Inc. vs CNH Industrial N.V.
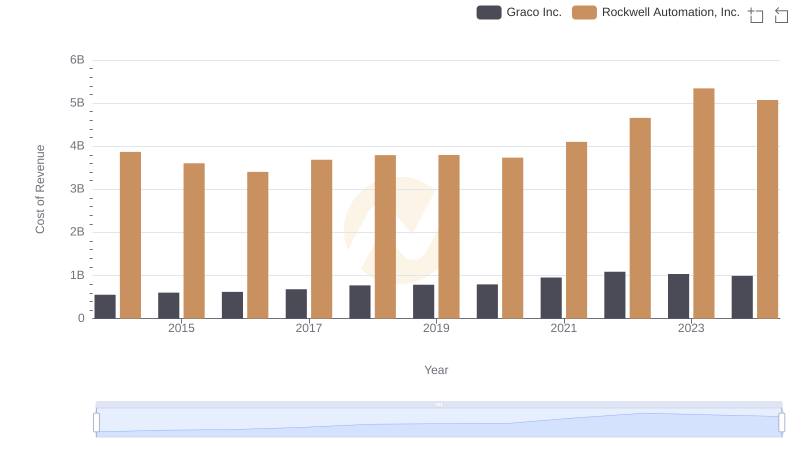
Cost Insights: Breaking Down Rockwell Automation, Inc. and Graco Inc.'s Expenses
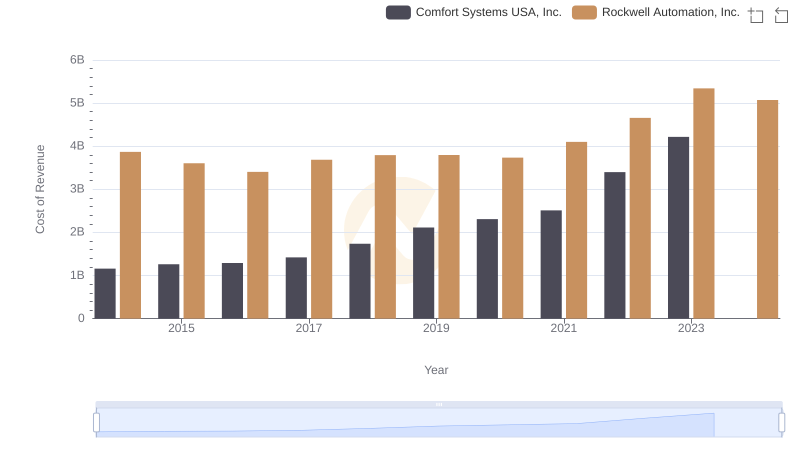
Cost of Revenue: Key Insights for Rockwell Automation, Inc. and Comfort Systems USA, Inc.
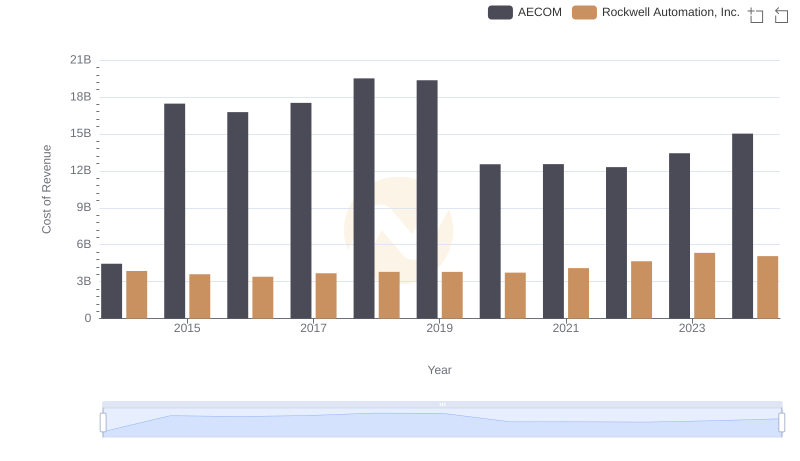
Cost of Revenue: Key Insights for Rockwell Automation, Inc. and AECOM
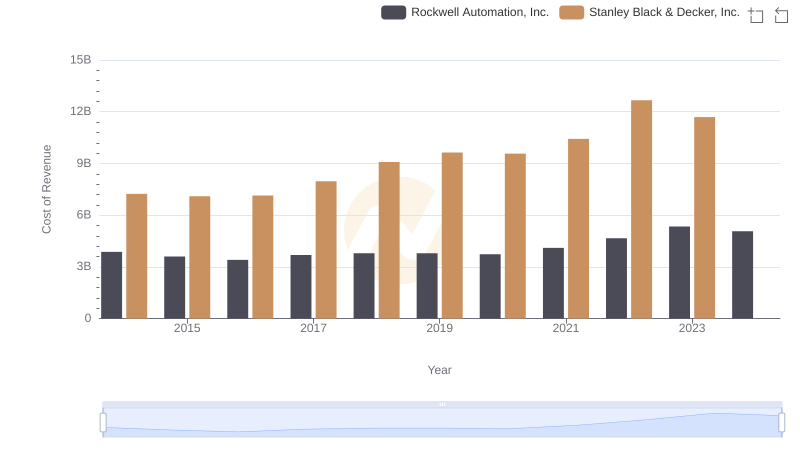
Rockwell Automation, Inc. vs Stanley Black & Decker, Inc.: Efficiency in Cost of Revenue Explored
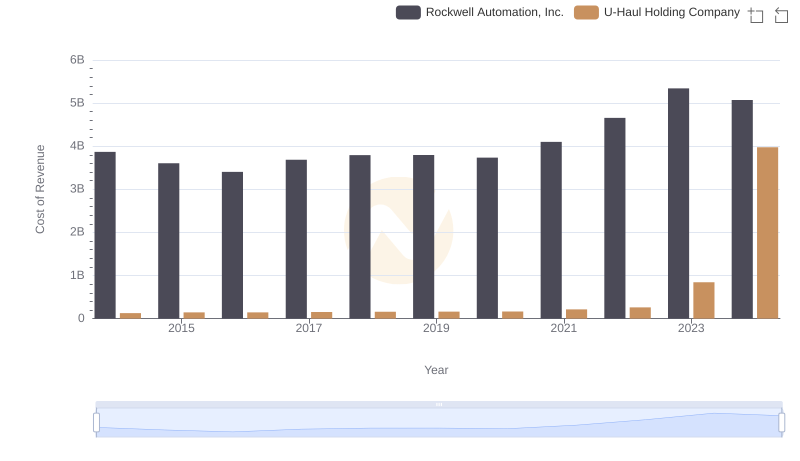
Analyzing Cost of Revenue: Rockwell Automation, Inc. and U-Haul Holding Company
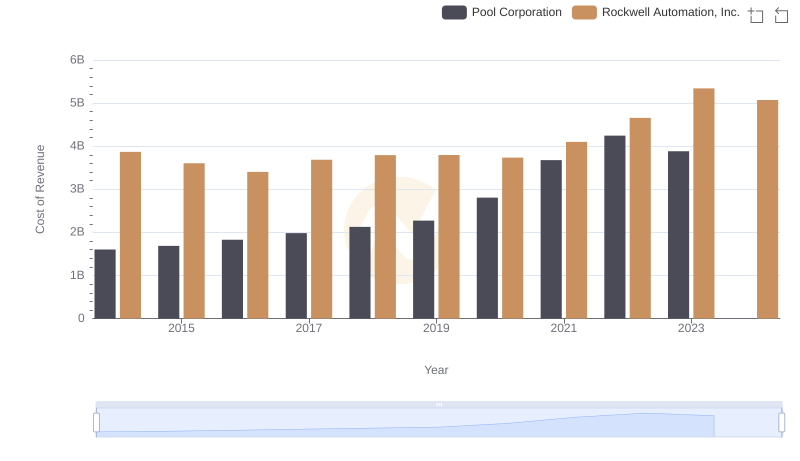
Analyzing Cost of Revenue: Rockwell Automation, Inc. and Pool Corporation
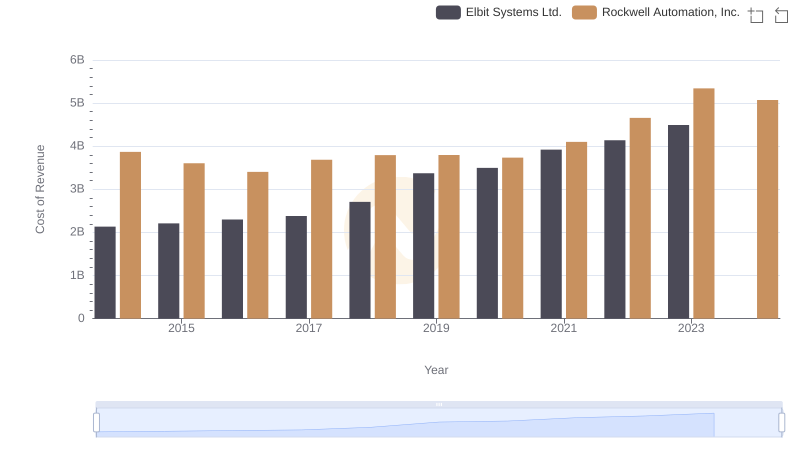
Cost Insights: Breaking Down Rockwell Automation, Inc. and Elbit Systems Ltd.'s Expenses
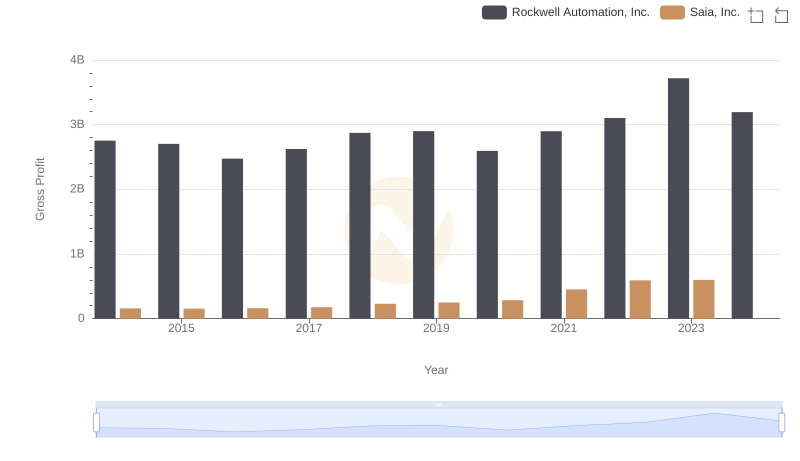
Key Insights on Gross Profit: Rockwell Automation, Inc. vs Saia, Inc.
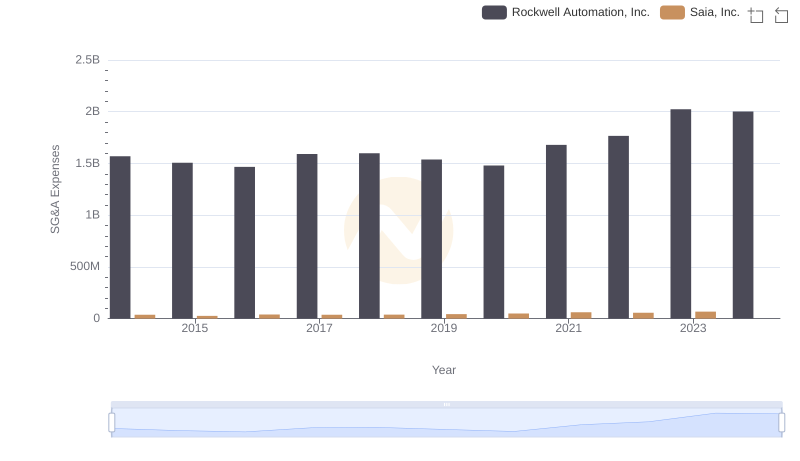
Comparing SG&A Expenses: Rockwell Automation, Inc. vs Saia, Inc. Trends and Insights