| __timestamp | CNH Industrial N.V. | Rockwell Automation, Inc. |
|---|---|---|
| Wednesday, January 1, 2014 | 25534000000 | 3869600000 |
| Thursday, January 1, 2015 | 20357000000 | 3604800000 |
| Friday, January 1, 2016 | 19539000000 | 3404000000 |
| Sunday, January 1, 2017 | 21621000000 | 3687100000 |
| Monday, January 1, 2018 | 22958000000 | 3793800000 |
| Tuesday, January 1, 2019 | 21832000000 | 3794700000 |
| Wednesday, January 1, 2020 | 21327000000 | 3734600000 |
| Friday, January 1, 2021 | 25951000000 | 4099700000 |
| Saturday, January 1, 2022 | 16797000000 | 4658400000 |
| Sunday, January 1, 2023 | 16805000000 | 5341000000 |
| Monday, January 1, 2024 | 5070800000 |
Unlocking the unknown
In the competitive landscape of industrial automation and machinery, Rockwell Automation, Inc. and CNH Industrial N.V. stand as titans. Over the past decade, these companies have showcased distinct strategies in managing their cost of revenue. From 2014 to 2023, CNH Industrial N.V. experienced a notable fluctuation, with a peak in 2021 and a significant drop by 2022, reflecting a 35% decrease. Meanwhile, Rockwell Automation, Inc. demonstrated a steady upward trend, culminating in a 38% increase by 2023. This divergence highlights Rockwell's consistent efficiency improvements, contrasting with CNH's volatility. The data for 2024 remains incomplete, leaving room for speculation on future trends. As these companies navigate the evolving market, their cost management strategies will be pivotal in maintaining competitive advantage.

Revenue Showdown: Rockwell Automation, Inc. vs CNH Industrial N.V.
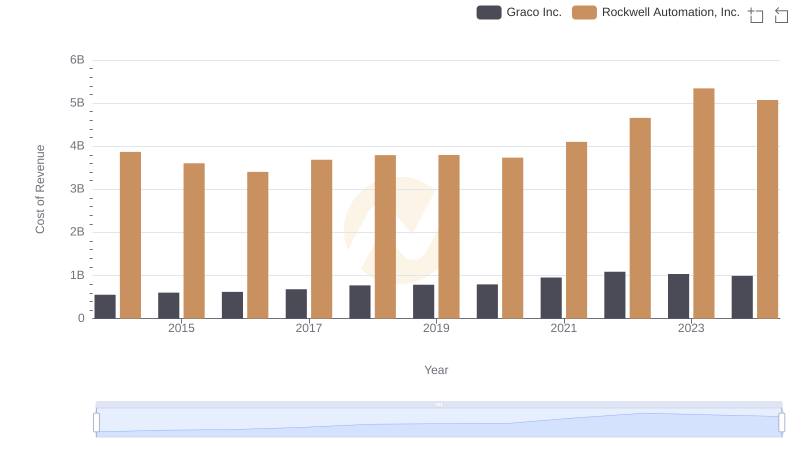
Cost Insights: Breaking Down Rockwell Automation, Inc. and Graco Inc.'s Expenses
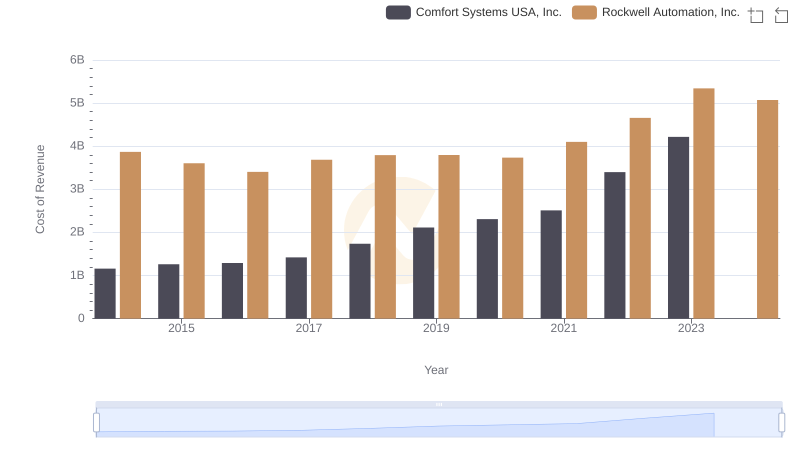
Cost of Revenue: Key Insights for Rockwell Automation, Inc. and Comfort Systems USA, Inc.
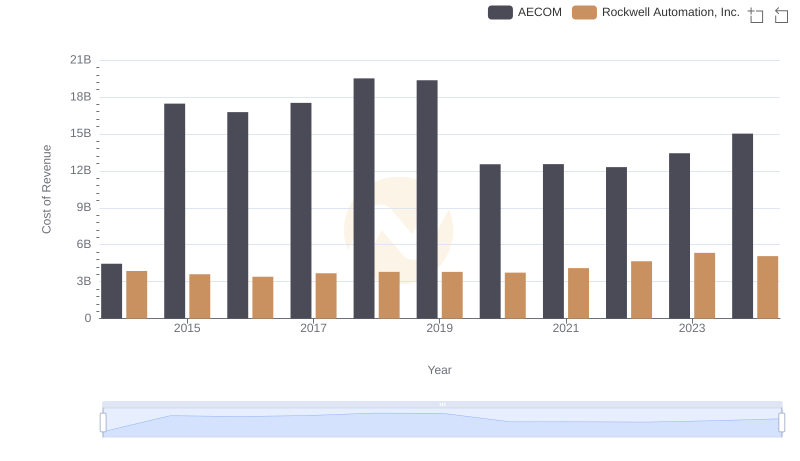
Cost of Revenue: Key Insights for Rockwell Automation, Inc. and AECOM
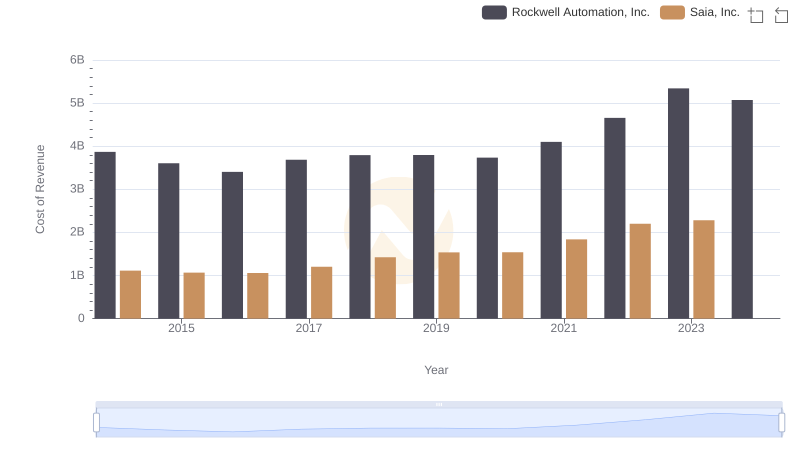
Cost of Revenue Comparison: Rockwell Automation, Inc. vs Saia, Inc.
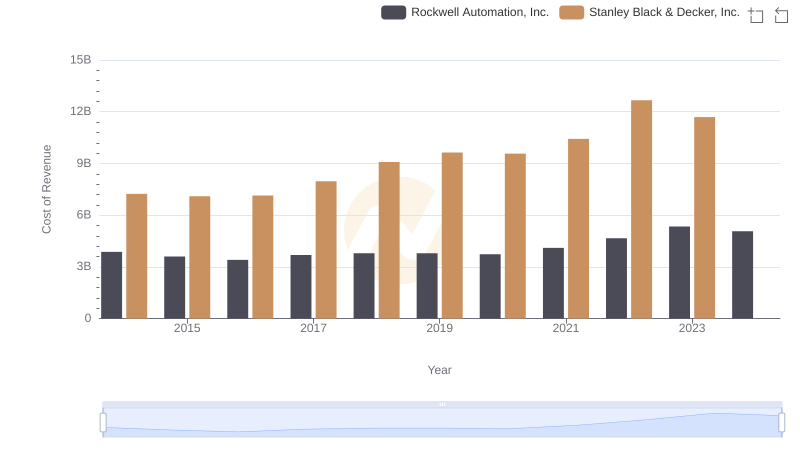
Rockwell Automation, Inc. vs Stanley Black & Decker, Inc.: Efficiency in Cost of Revenue Explored
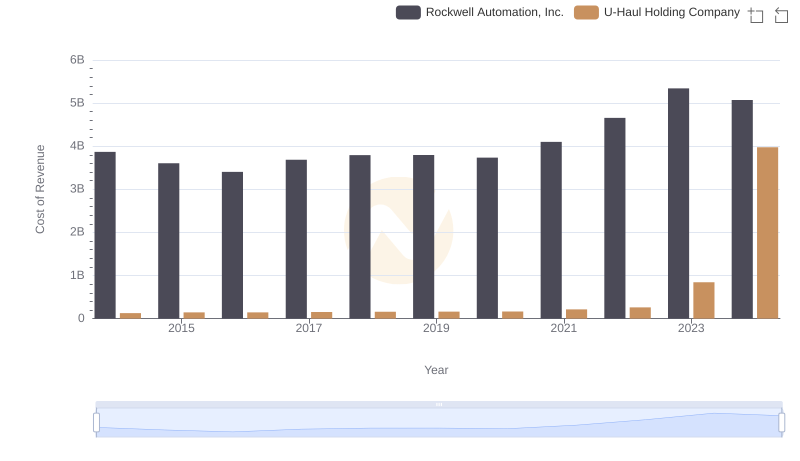
Analyzing Cost of Revenue: Rockwell Automation, Inc. and U-Haul Holding Company
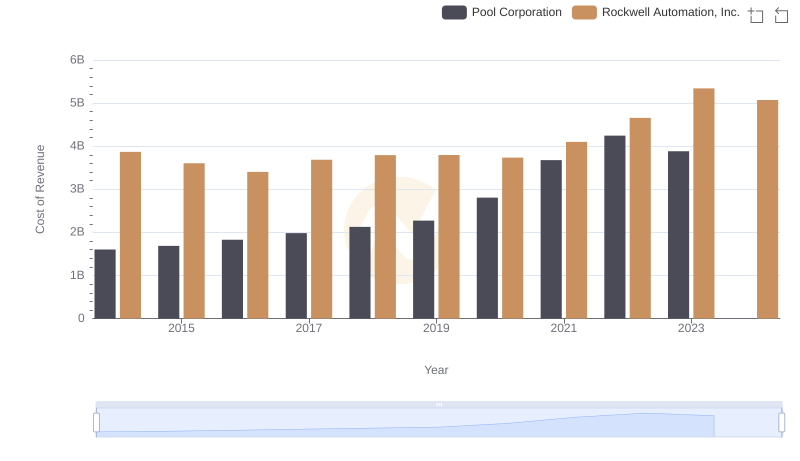
Analyzing Cost of Revenue: Rockwell Automation, Inc. and Pool Corporation
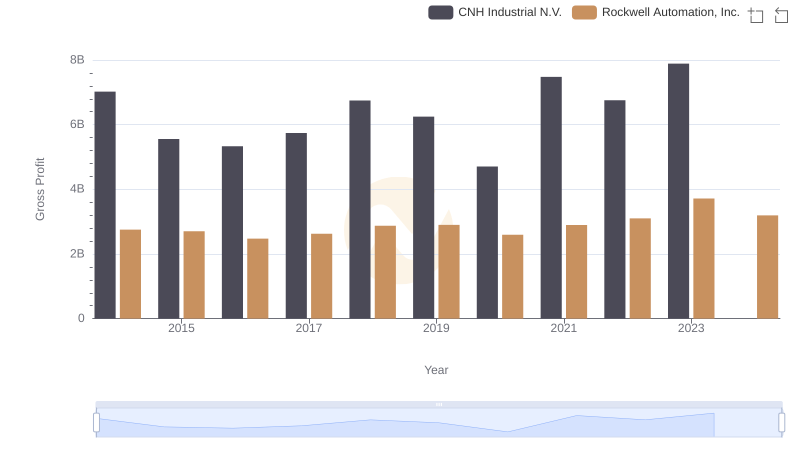
Rockwell Automation, Inc. and CNH Industrial N.V.: A Detailed Gross Profit Analysis
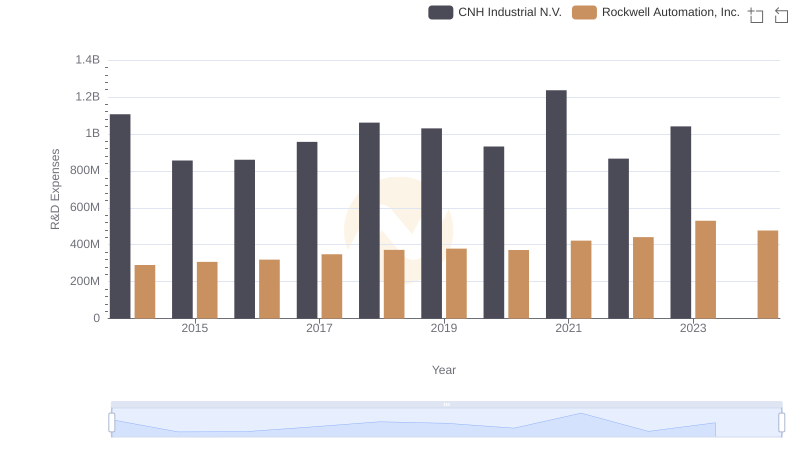
Research and Development Expenses Breakdown: Rockwell Automation, Inc. vs CNH Industrial N.V.
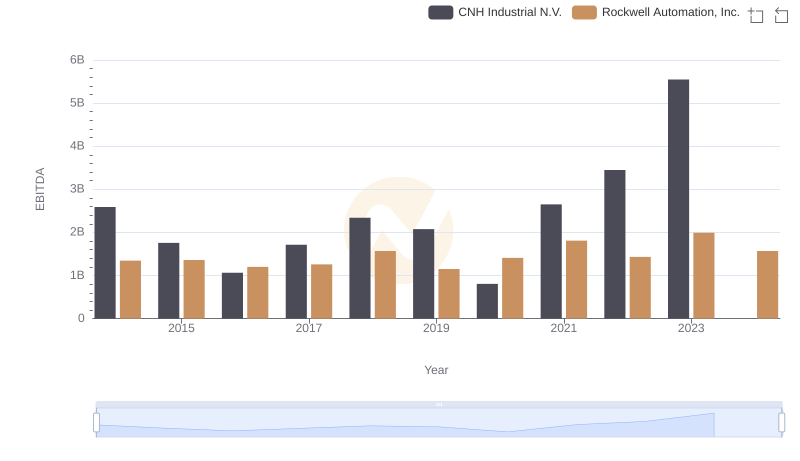
A Side-by-Side Analysis of EBITDA: Rockwell Automation, Inc. and CNH Industrial N.V.