| __timestamp | Graco Inc. | Rockwell Automation, Inc. |
|---|---|---|
| Wednesday, January 1, 2014 | 554394000 | 3869600000 |
| Thursday, January 1, 2015 | 601785000 | 3604800000 |
| Friday, January 1, 2016 | 621054000 | 3404000000 |
| Sunday, January 1, 2017 | 681695000 | 3687100000 |
| Monday, January 1, 2018 | 770753000 | 3793800000 |
| Tuesday, January 1, 2019 | 786289000 | 3794700000 |
| Wednesday, January 1, 2020 | 795178000 | 3734600000 |
| Friday, January 1, 2021 | 953659000 | 4099700000 |
| Saturday, January 1, 2022 | 1086082000 | 4658400000 |
| Sunday, January 1, 2023 | 1034585000 | 5341000000 |
| Monday, January 1, 2024 | 990855000 | 5070800000 |
Unlocking the unknown
In the ever-evolving landscape of industrial automation, understanding cost structures is pivotal. Rockwell Automation, Inc. and Graco Inc., two giants in this field, have shown distinct trends in their cost of revenue over the past decade. From 2014 to 2023, Rockwell Automation's cost of revenue has surged by approximately 38%, peaking in 2023. In contrast, Graco Inc. experienced a more modest increase of around 86% during the same period, with a notable peak in 2022. This divergence highlights Rockwell's aggressive expansion and Graco's steady growth strategy. The data reveals that while Rockwell's costs are significantly higher, Graco's growth rate is impressive, suggesting a leaner operational model. As the industry continues to innovate, these insights provide a window into the strategic priorities of these leading companies.
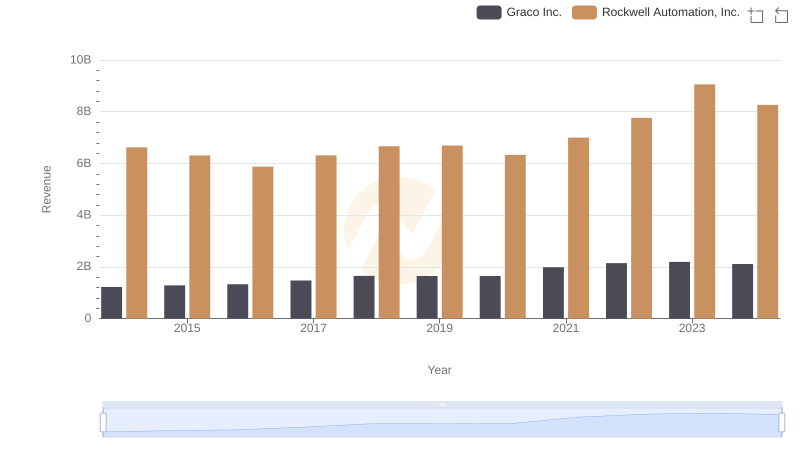
Rockwell Automation, Inc. vs Graco Inc.: Examining Key Revenue Metrics
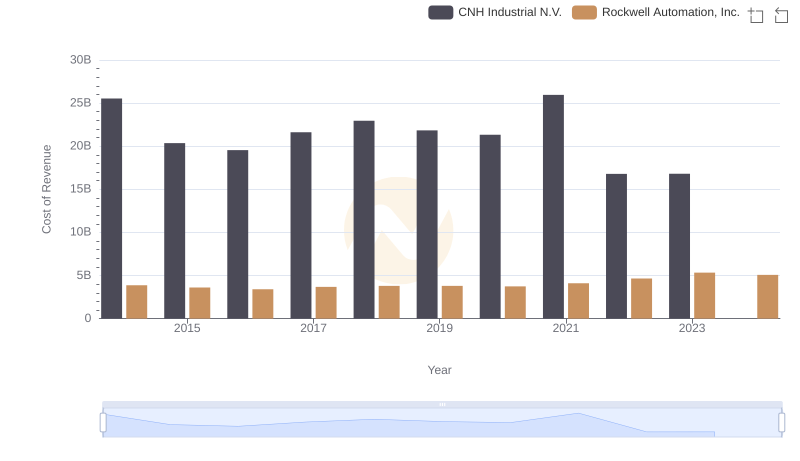
Comparing Cost of Revenue Efficiency: Rockwell Automation, Inc. vs CNH Industrial N.V.
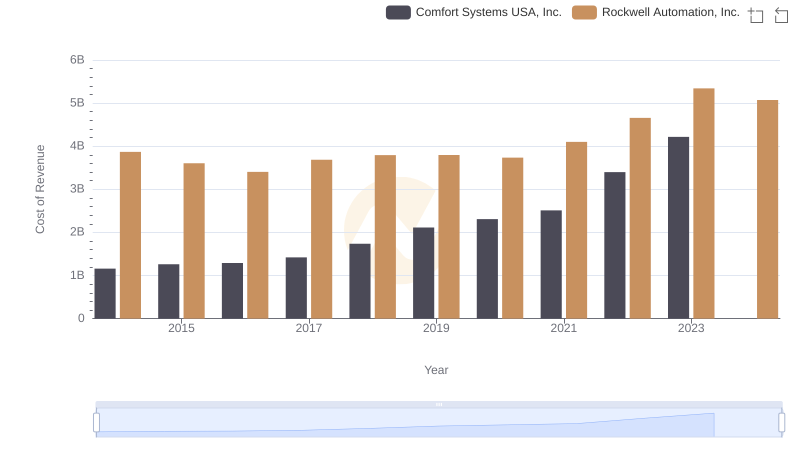
Cost of Revenue: Key Insights for Rockwell Automation, Inc. and Comfort Systems USA, Inc.
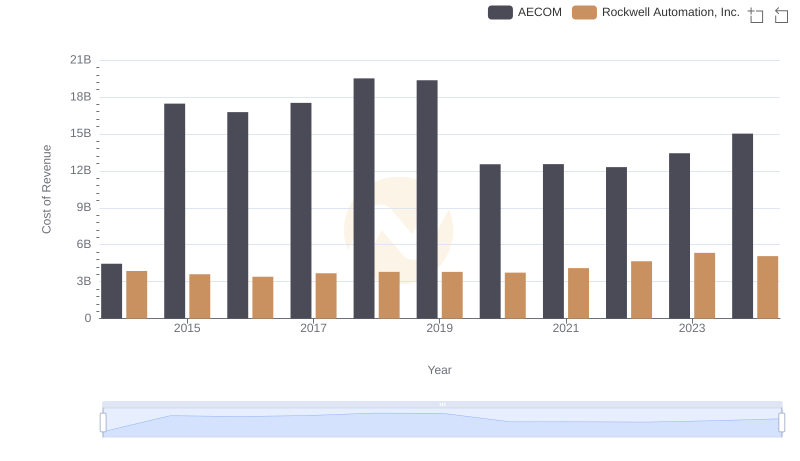
Cost of Revenue: Key Insights for Rockwell Automation, Inc. and AECOM
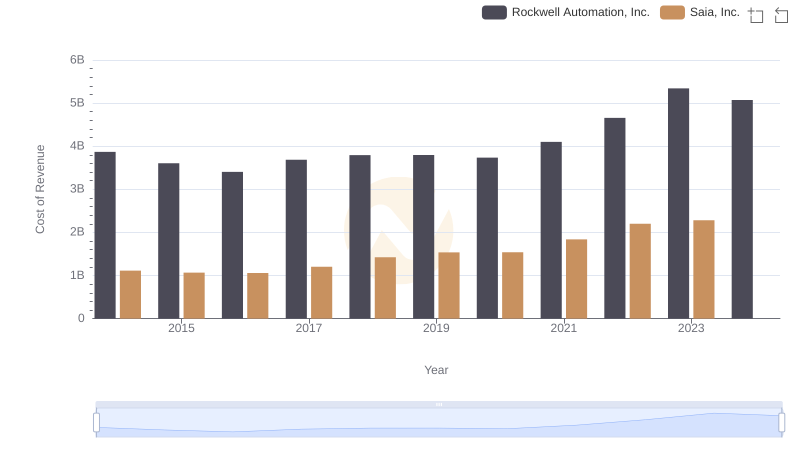
Cost of Revenue Comparison: Rockwell Automation, Inc. vs Saia, Inc.
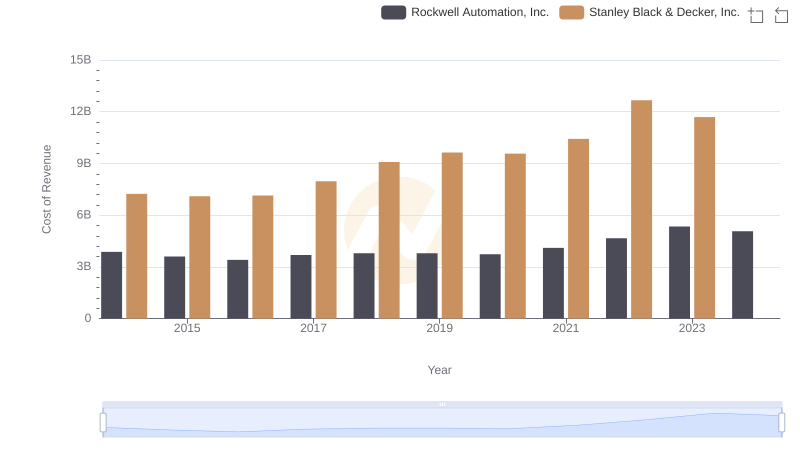
Rockwell Automation, Inc. vs Stanley Black & Decker, Inc.: Efficiency in Cost of Revenue Explored
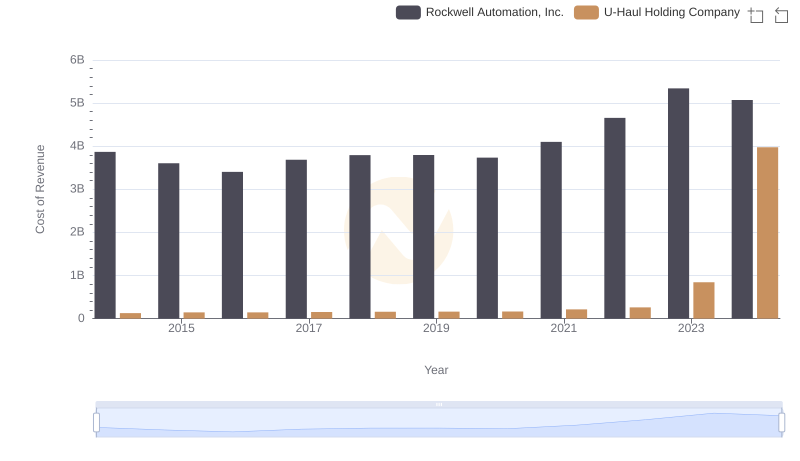
Analyzing Cost of Revenue: Rockwell Automation, Inc. and U-Haul Holding Company
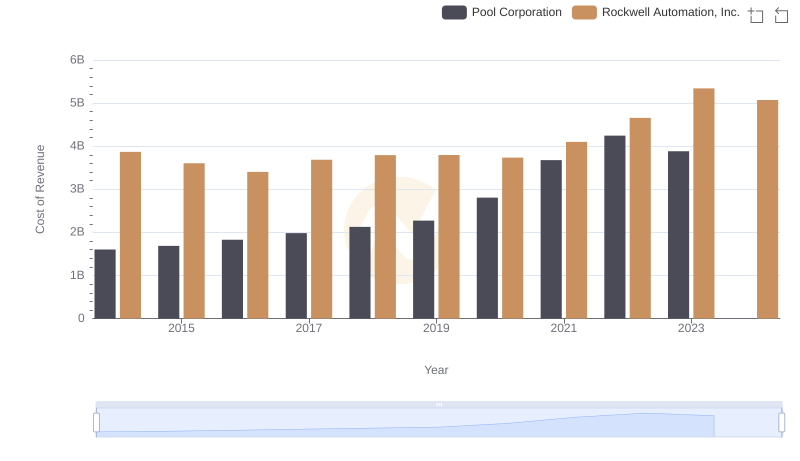
Analyzing Cost of Revenue: Rockwell Automation, Inc. and Pool Corporation
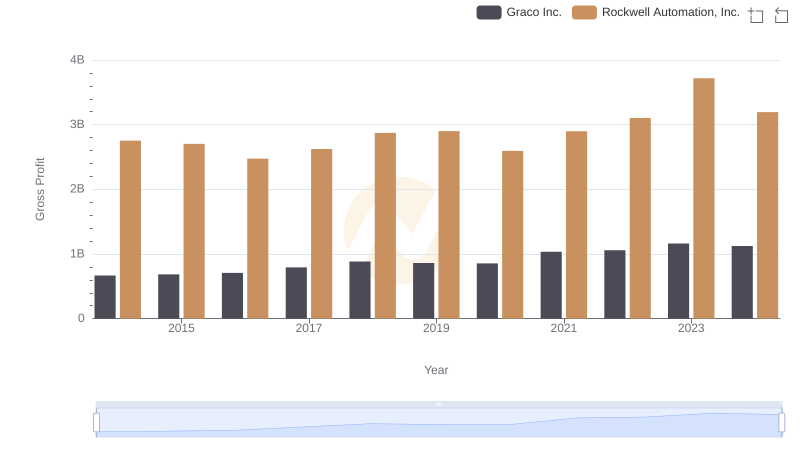
Gross Profit Trends Compared: Rockwell Automation, Inc. vs Graco Inc.
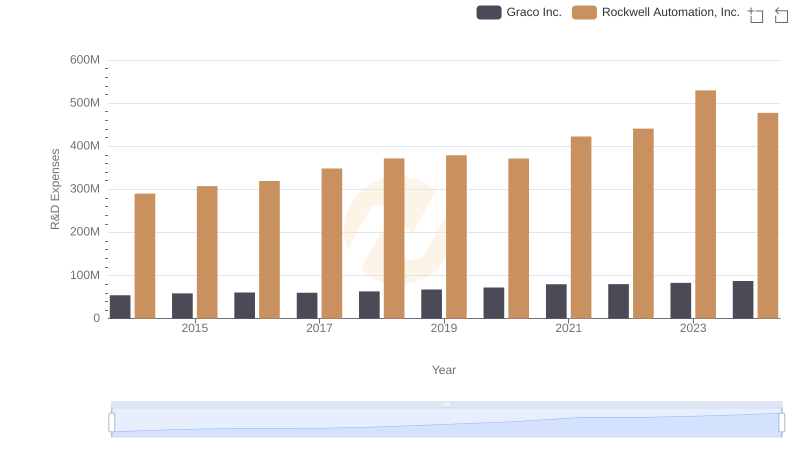
Research and Development Expenses Breakdown: Rockwell Automation, Inc. vs Graco Inc.
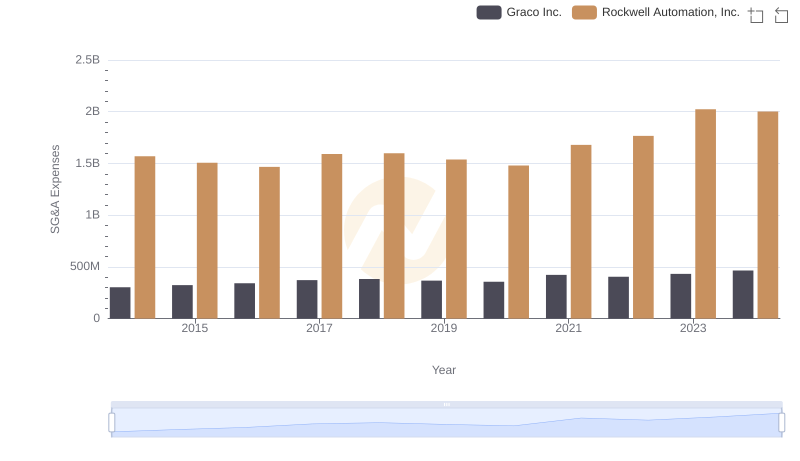
Rockwell Automation, Inc. and Graco Inc.: SG&A Spending Patterns Compared
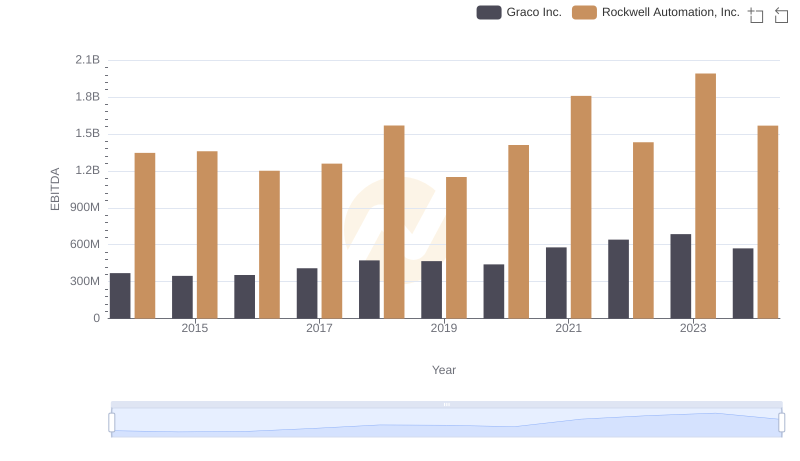
A Side-by-Side Analysis of EBITDA: Rockwell Automation, Inc. and Graco Inc.