| __timestamp | Rockwell Automation, Inc. | U-Haul Holding Company |
|---|---|---|
| Wednesday, January 1, 2014 | 3869600000 | 127270000 |
| Thursday, January 1, 2015 | 3604800000 | 146072000 |
| Friday, January 1, 2016 | 3404000000 | 144990000 |
| Sunday, January 1, 2017 | 3687100000 | 152485000 |
| Monday, January 1, 2018 | 3793800000 | 160489000 |
| Tuesday, January 1, 2019 | 3794700000 | 162142000 |
| Wednesday, January 1, 2020 | 3734600000 | 164018000 |
| Friday, January 1, 2021 | 4099700000 | 214059000 |
| Saturday, January 1, 2022 | 4658400000 | 259585000 |
| Sunday, January 1, 2023 | 5341000000 | 844894000 |
| Monday, January 1, 2024 | 5070800000 | 3976040000 |
Cracking the code
In the ever-evolving landscape of industrial automation and transportation, Rockwell Automation, Inc. and U-Haul Holding Company stand as intriguing case studies. Over the past decade, Rockwell Automation has seen a steady increase in its cost of revenue, peaking in 2023 with a 38% rise from 2014. This reflects the company's strategic investments in cutting-edge technology and global expansion. Meanwhile, U-Haul Holding Company, a stalwart in the moving and storage industry, experienced a dramatic surge in 2024, with its cost of revenue skyrocketing by over 3000% compared to 2014. This leap underscores U-Haul's aggressive growth strategy and adaptation to changing consumer demands. As we delve into these figures, it becomes evident that both companies are navigating their unique paths in response to market dynamics, offering valuable insights into their operational strategies.
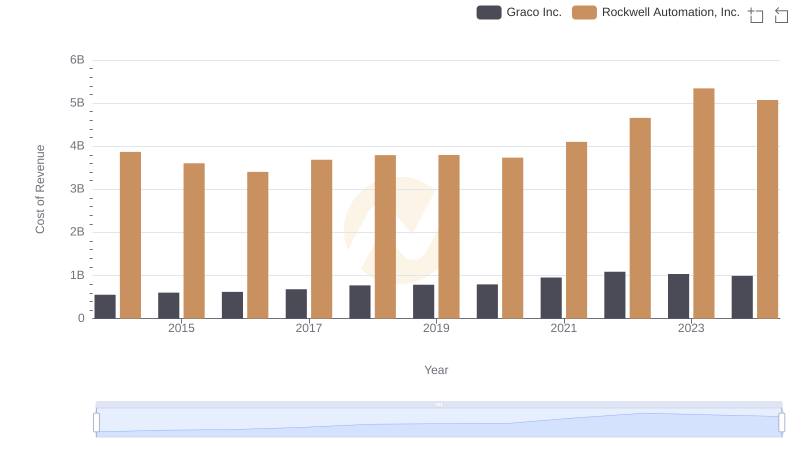
Cost Insights: Breaking Down Rockwell Automation, Inc. and Graco Inc.'s Expenses
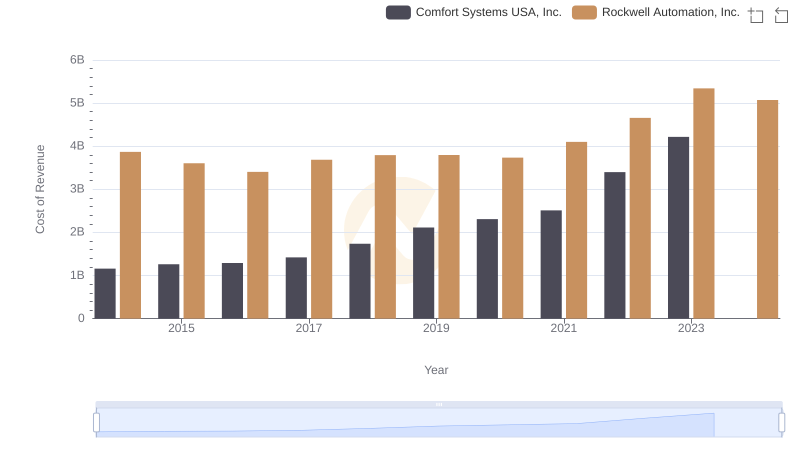
Cost of Revenue: Key Insights for Rockwell Automation, Inc. and Comfort Systems USA, Inc.
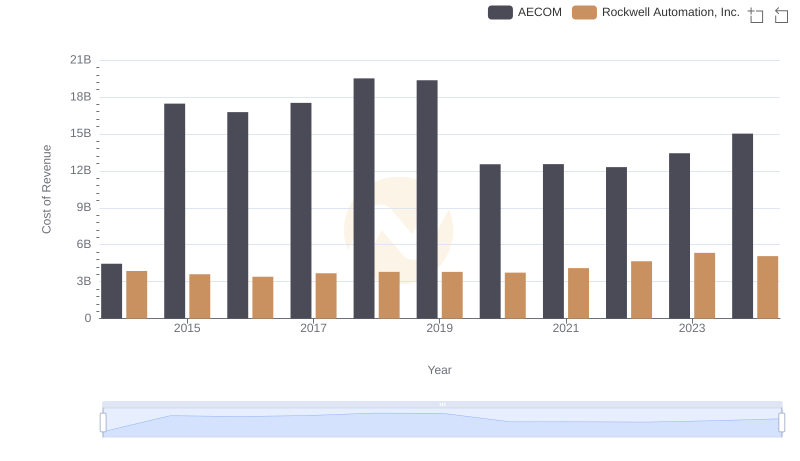
Cost of Revenue: Key Insights for Rockwell Automation, Inc. and AECOM
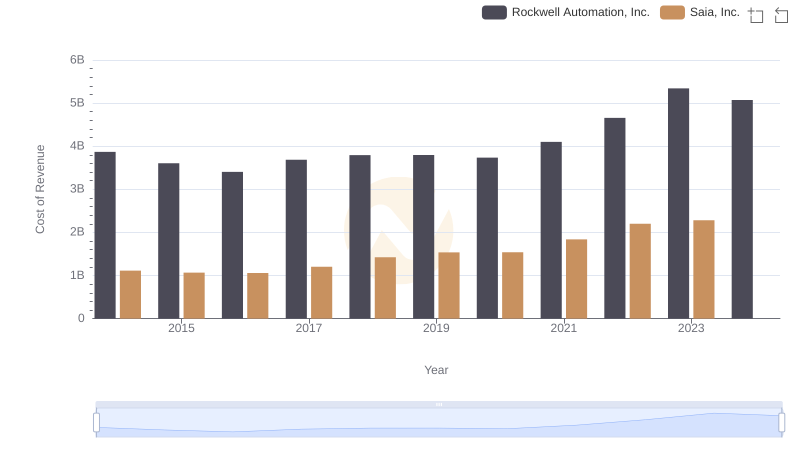
Cost of Revenue Comparison: Rockwell Automation, Inc. vs Saia, Inc.
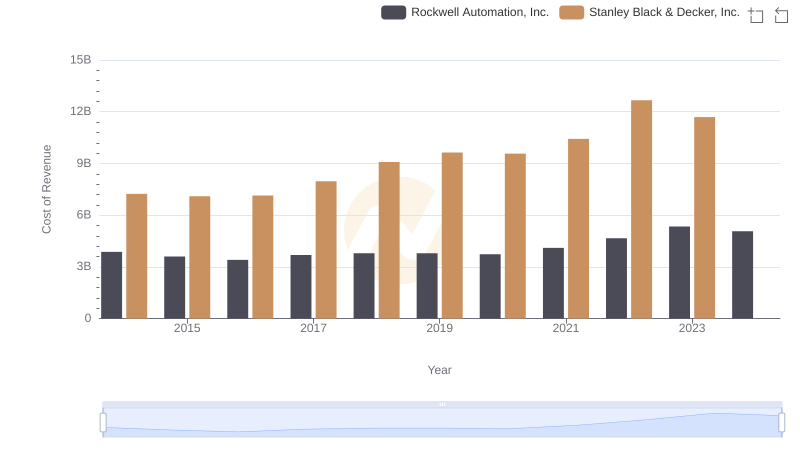
Rockwell Automation, Inc. vs Stanley Black & Decker, Inc.: Efficiency in Cost of Revenue Explored
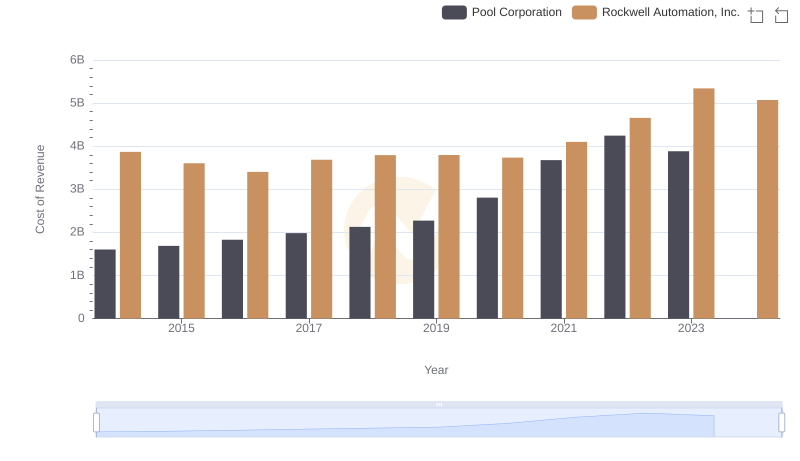
Analyzing Cost of Revenue: Rockwell Automation, Inc. and Pool Corporation
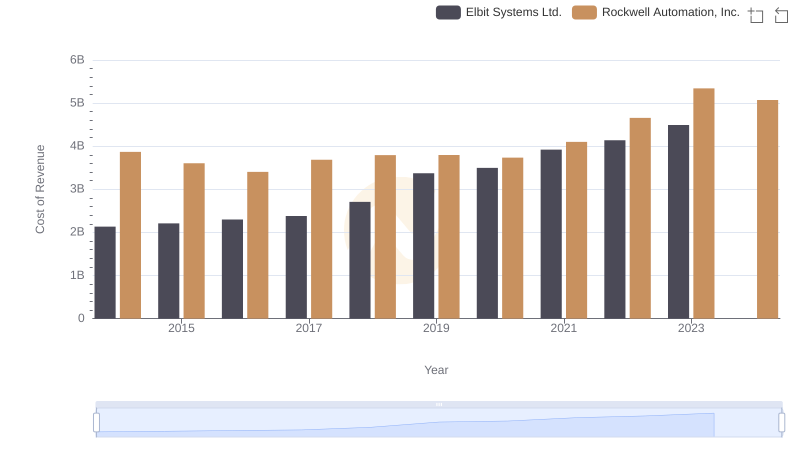
Cost Insights: Breaking Down Rockwell Automation, Inc. and Elbit Systems Ltd.'s Expenses
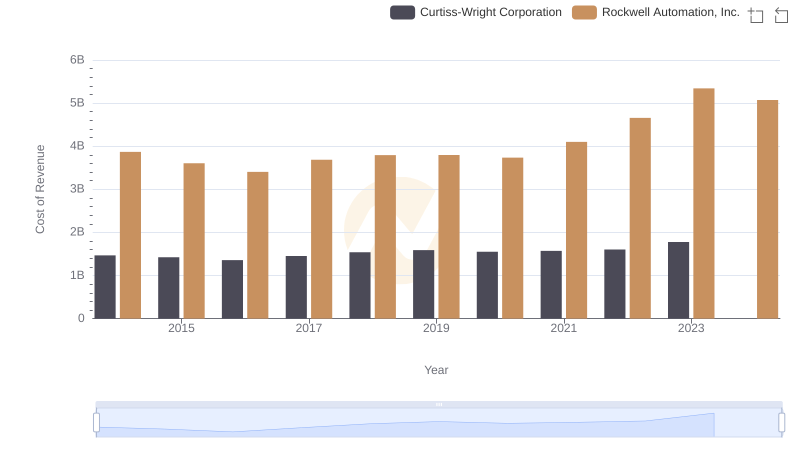
Cost of Revenue Trends: Rockwell Automation, Inc. vs Curtiss-Wright Corporation
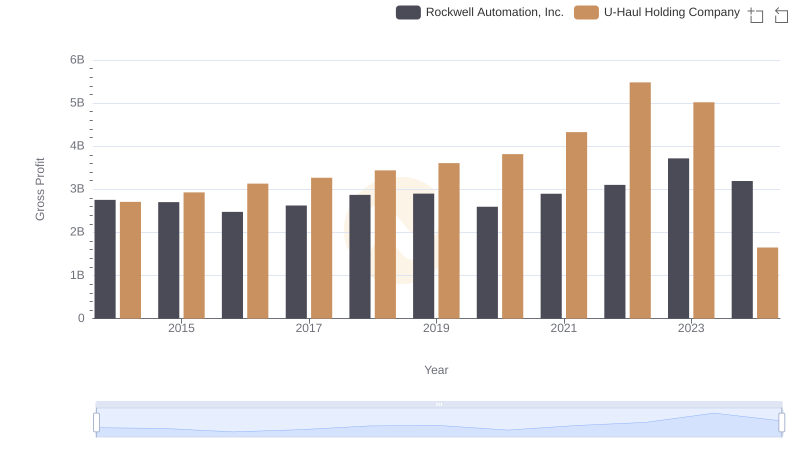
Who Generates Higher Gross Profit? Rockwell Automation, Inc. or U-Haul Holding Company

SG&A Efficiency Analysis: Comparing Rockwell Automation, Inc. and U-Haul Holding Company
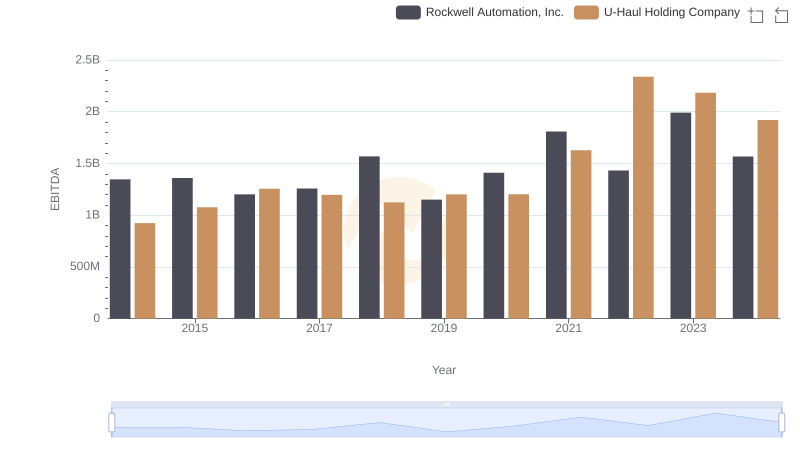
Rockwell Automation, Inc. and U-Haul Holding Company: A Detailed Examination of EBITDA Performance