| __timestamp | Global Payments Inc. | Jacobs Engineering Group Inc. |
|---|---|---|
| Wednesday, January 1, 2014 | 1022107000 | 10621373000 |
| Thursday, January 1, 2015 | 1147639000 | 10146494000 |
| Friday, January 1, 2016 | 1603532000 | 9196326000 |
| Sunday, January 1, 2017 | 1928037000 | 8250536000 |
| Monday, January 1, 2018 | 1095014000 | 12156276000 |
| Tuesday, January 1, 2019 | 2073803000 | 10260840000 |
| Wednesday, January 1, 2020 | 3650727000 | 10980307000 |
| Friday, January 1, 2021 | 3773725000 | 11048860000 |
| Saturday, January 1, 2022 | 3778617000 | 11595785000 |
| Sunday, January 1, 2023 | 3727521000 | 12879099000 |
| Monday, January 1, 2024 | 3760116000 | 8668185000 |
Unleashing insights
In the ever-evolving landscape of corporate finance, understanding cost structures is pivotal. Global Payments Inc. and Jacobs Engineering Group Inc. offer a fascinating study in contrasts. Over the past decade, Global Payments Inc. has seen its cost of revenue grow by approximately 265%, peaking in 2022. Meanwhile, Jacobs Engineering Group Inc. maintained a more stable trajectory, with costs fluctuating around a 10% range annually.
This analysis highlights the dynamic nature of financial strategies and the importance of cost management in sustaining growth.
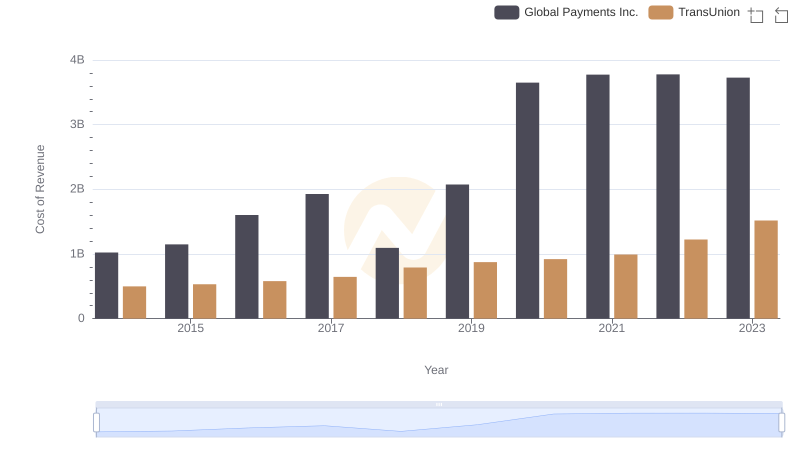
Cost of Revenue Trends: Global Payments Inc. vs TransUnion
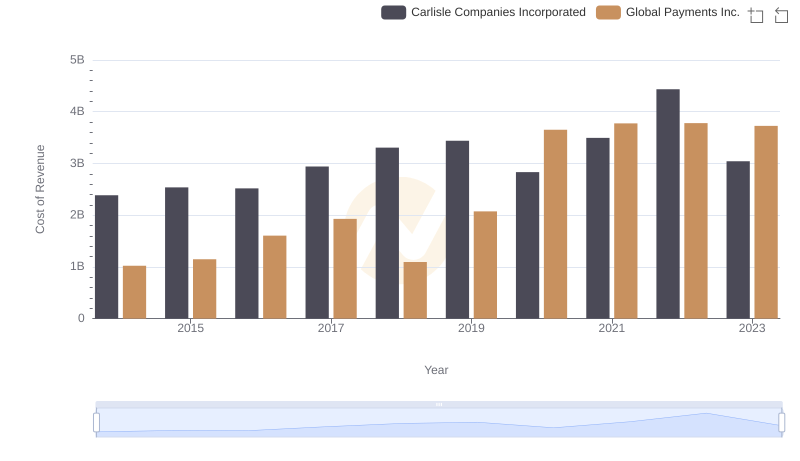
Cost of Revenue Comparison: Global Payments Inc. vs Carlisle Companies Incorporated
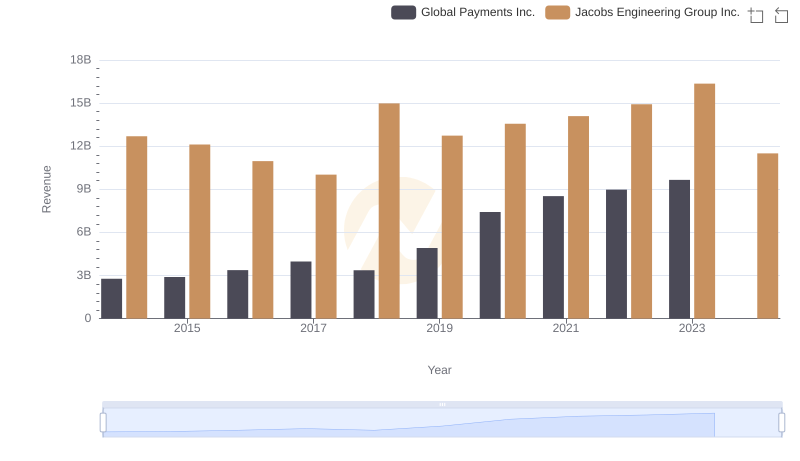
Revenue Insights: Global Payments Inc. and Jacobs Engineering Group Inc. Performance Compared
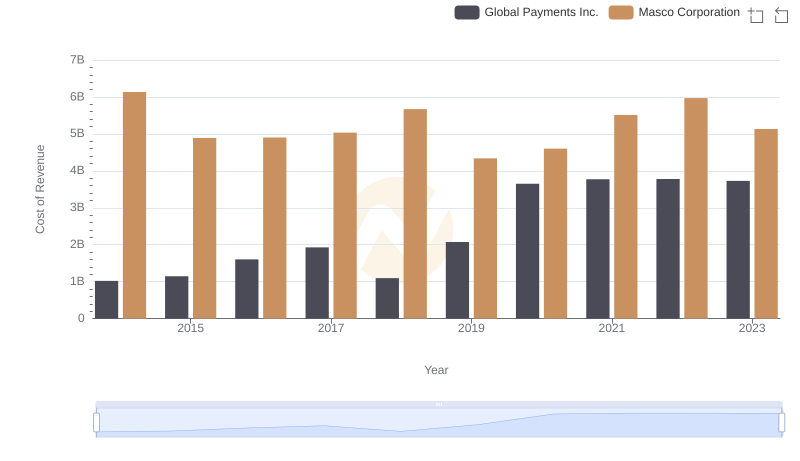
Analyzing Cost of Revenue: Global Payments Inc. and Masco Corporation
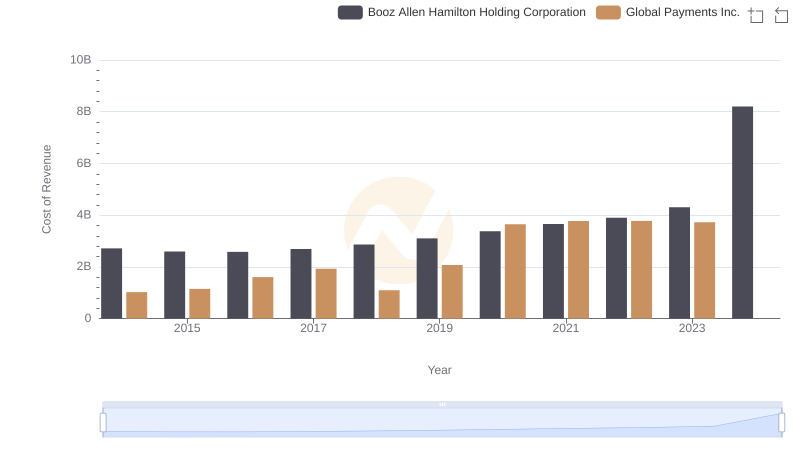
Comparing Cost of Revenue Efficiency: Global Payments Inc. vs Booz Allen Hamilton Holding Corporation
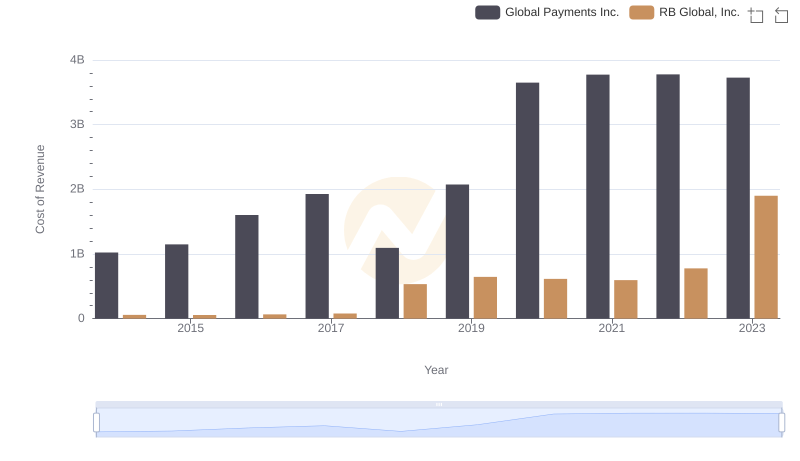
Cost of Revenue: Key Insights for Global Payments Inc. and RB Global, Inc.
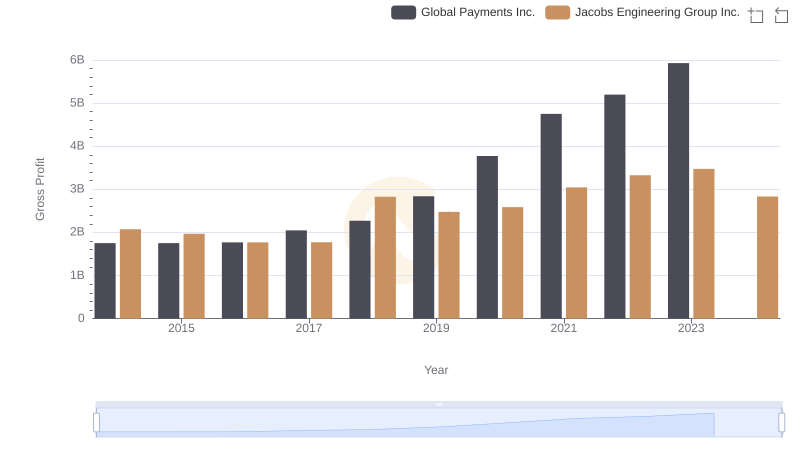
Global Payments Inc. vs Jacobs Engineering Group Inc.: A Gross Profit Performance Breakdown
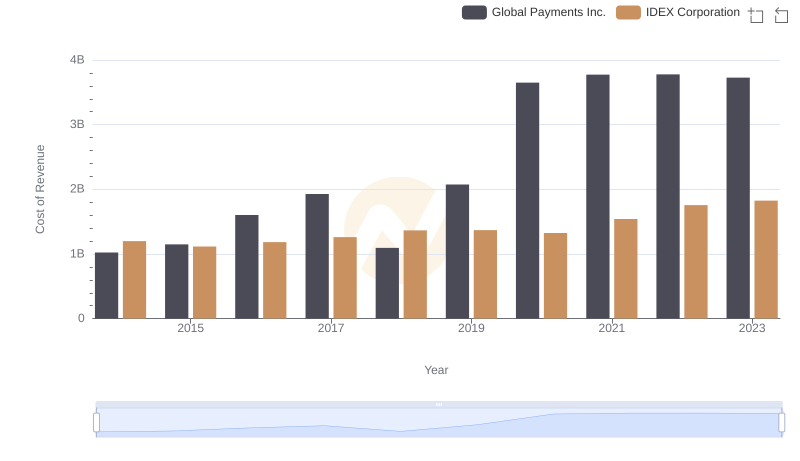
Comparing Cost of Revenue Efficiency: Global Payments Inc. vs IDEX Corporation
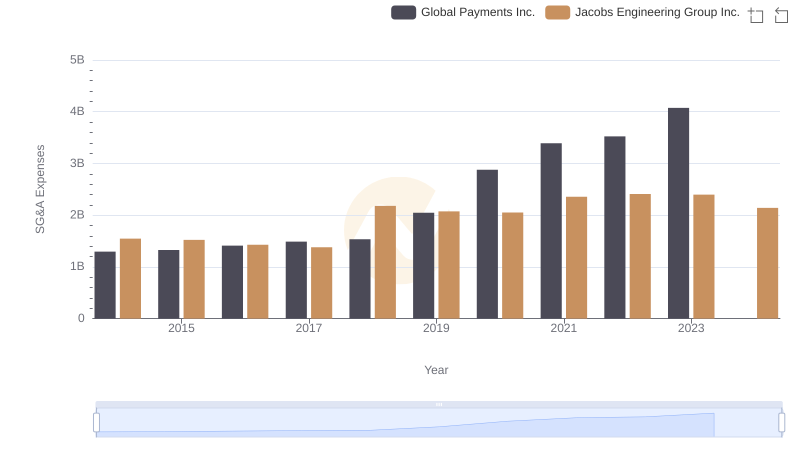
Cost Management Insights: SG&A Expenses for Global Payments Inc. and Jacobs Engineering Group Inc.
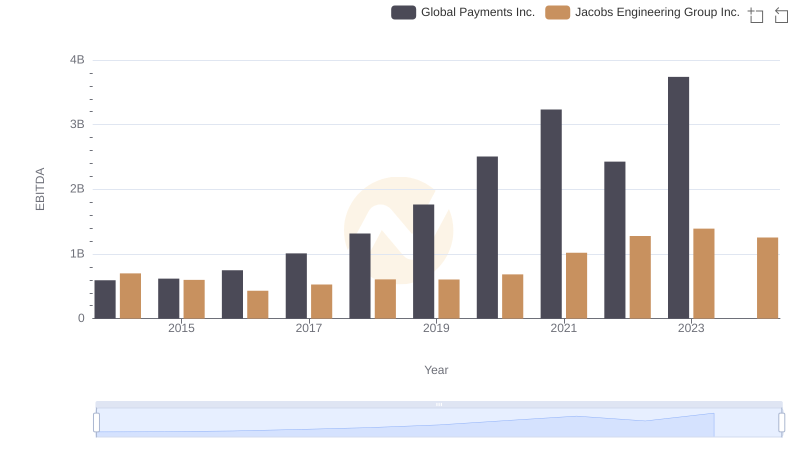
EBITDA Analysis: Evaluating Global Payments Inc. Against Jacobs Engineering Group Inc.