| __timestamp | Avery Dennison Corporation | Global Payments Inc. |
|---|---|---|
| Wednesday, January 1, 2014 | 4679100000 | 1022107000 |
| Thursday, January 1, 2015 | 4321100000 | 1147639000 |
| Friday, January 1, 2016 | 4386800000 | 1603532000 |
| Sunday, January 1, 2017 | 4801600000 | 1928037000 |
| Monday, January 1, 2018 | 5243500000 | 1095014000 |
| Tuesday, January 1, 2019 | 5166000000 | 2073803000 |
| Wednesday, January 1, 2020 | 5048200000 | 3650727000 |
| Friday, January 1, 2021 | 6095500000 | 3773725000 |
| Saturday, January 1, 2022 | 6635100000 | 3778617000 |
| Sunday, January 1, 2023 | 6086800000 | 3727521000 |
| Monday, January 1, 2024 | 6225000000 | 3760116000 |
Unlocking the unknown
In the ever-evolving landscape of global commerce, understanding the cost of revenue is crucial for assessing a company's financial health. Over the past decade, Avery Dennison Corporation and Global Payments Inc. have showcased contrasting trajectories in their cost of revenue.
From 2014 to 2023, Avery Dennison's cost of revenue has seen a steady increase, peaking in 2022 with a 53% rise from its 2015 low. This reflects the company's robust growth and strategic investments in its core operations. In contrast, Global Payments Inc. experienced a more volatile journey, with a significant 270% surge from 2014 to 2022, highlighting its aggressive expansion and adaptation to the digital payment revolution.
These trends underscore the dynamic nature of the industry, where strategic decisions and market conditions play pivotal roles in shaping financial outcomes.
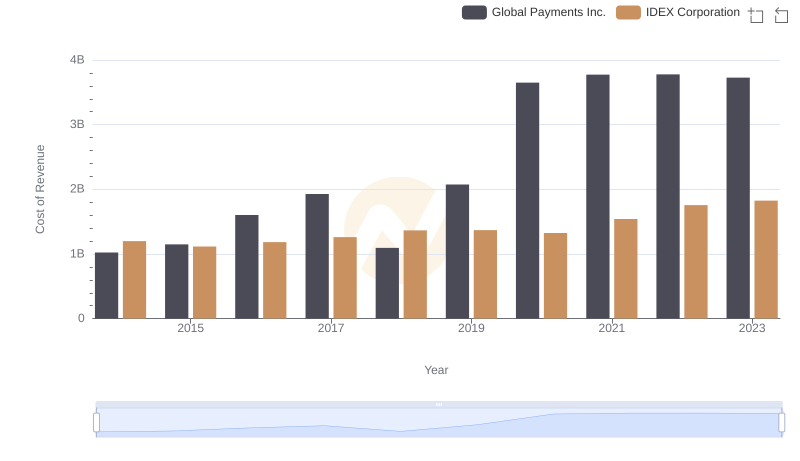
Comparing Cost of Revenue Efficiency: Global Payments Inc. vs IDEX Corporation
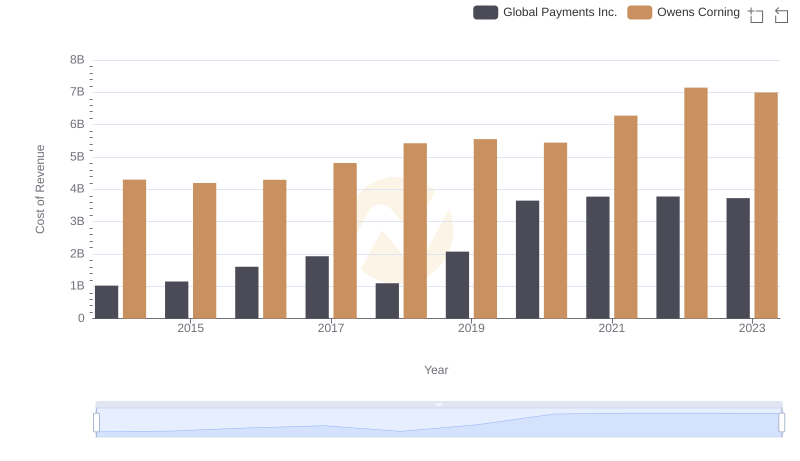
Cost of Revenue Trends: Global Payments Inc. vs Owens Corning
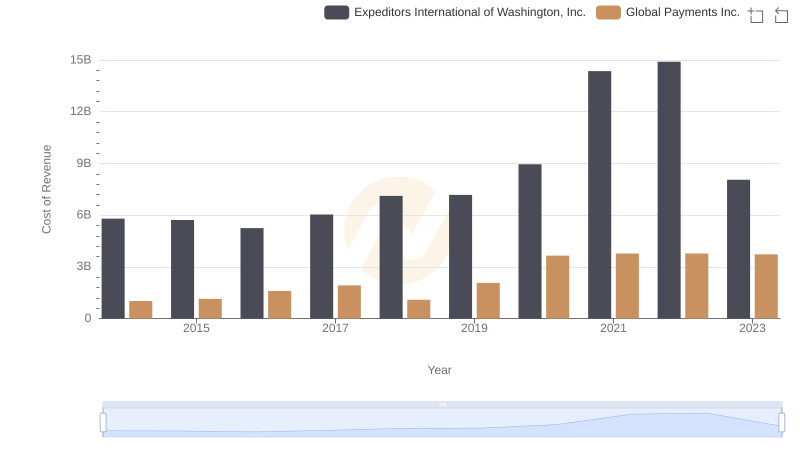
Analyzing Cost of Revenue: Global Payments Inc. and Expeditors International of Washington, Inc.
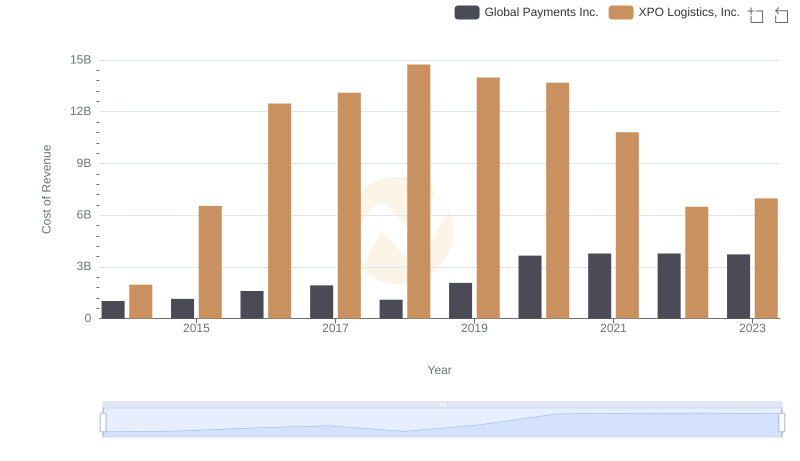
Cost of Revenue Comparison: Global Payments Inc. vs XPO Logistics, Inc.
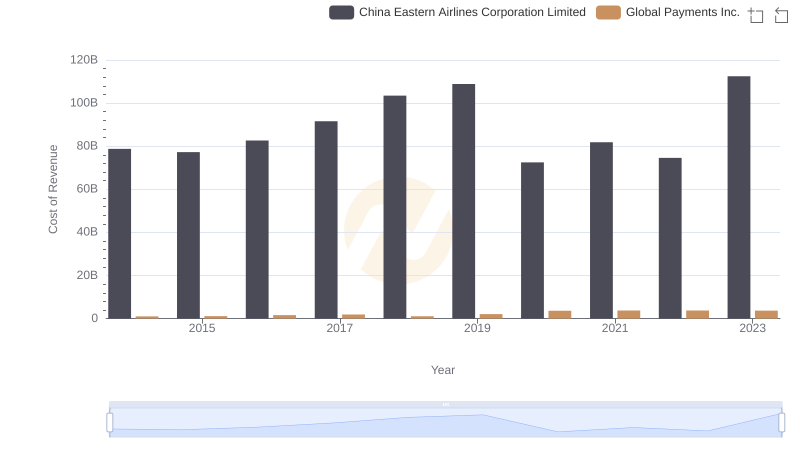
Cost of Revenue Trends: Global Payments Inc. vs China Eastern Airlines Corporation Limited
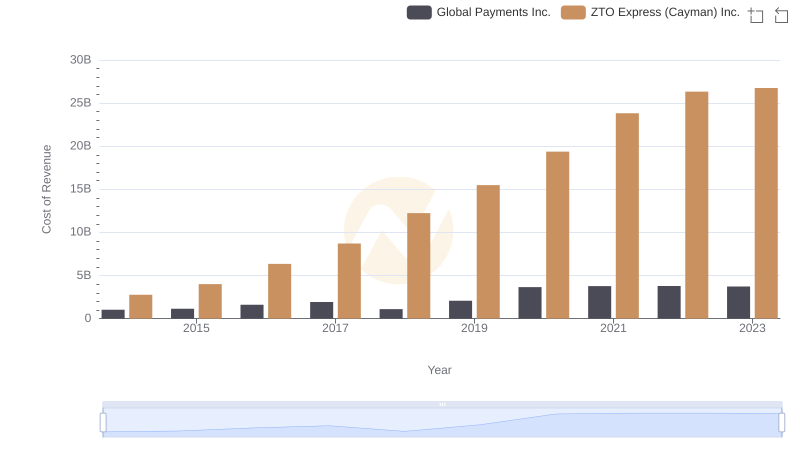
Analyzing Cost of Revenue: Global Payments Inc. and ZTO Express (Cayman) Inc.
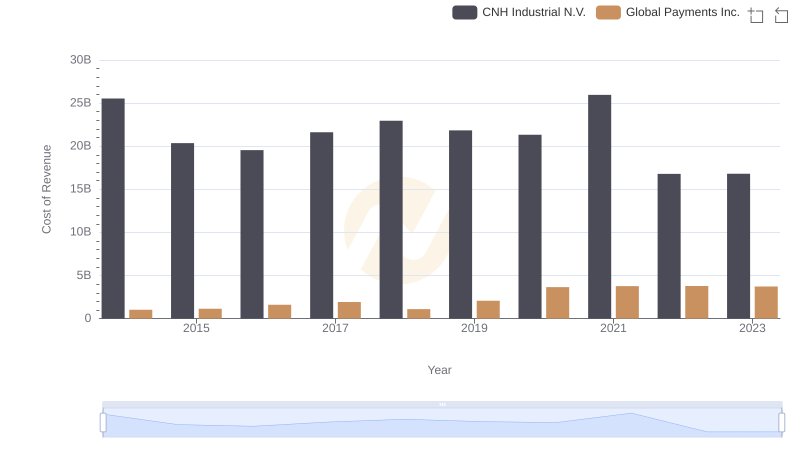
Cost of Revenue Comparison: Global Payments Inc. vs CNH Industrial N.V.
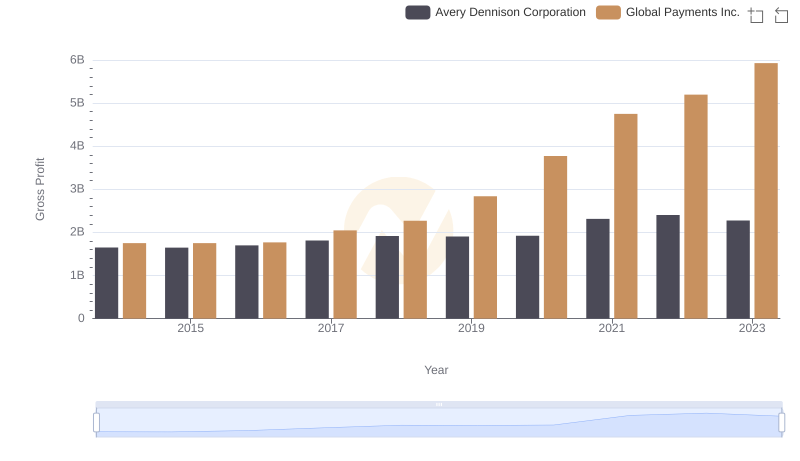
Global Payments Inc. vs Avery Dennison Corporation: A Gross Profit Performance Breakdown
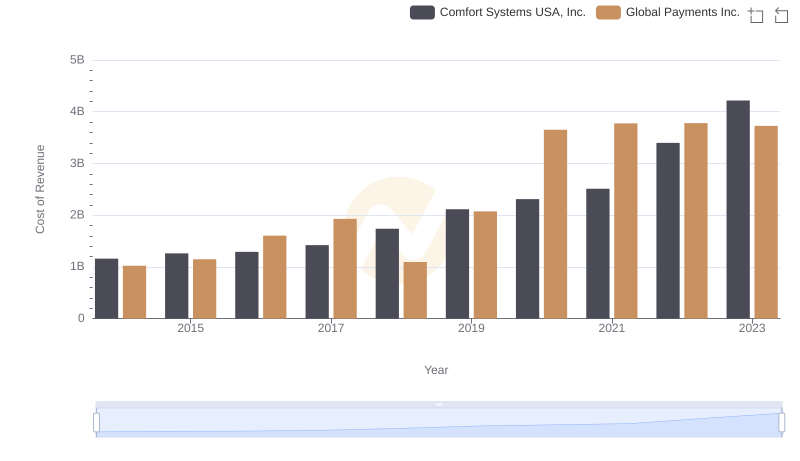
Comparing Cost of Revenue Efficiency: Global Payments Inc. vs Comfort Systems USA, Inc.
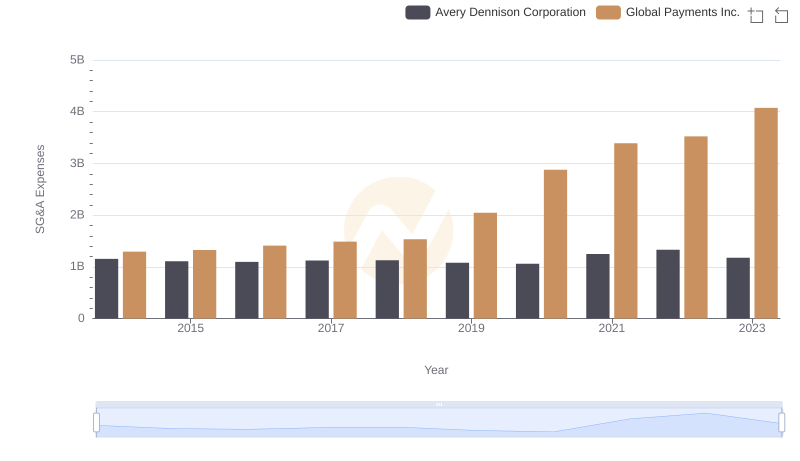
Comparing SG&A Expenses: Global Payments Inc. vs Avery Dennison Corporation Trends and Insights