| __timestamp | Global Payments Inc. | IDEX Corporation |
|---|---|---|
| Wednesday, January 1, 2014 | 1022107000 | 1198452000 |
| Thursday, January 1, 2015 | 1147639000 | 1116353000 |
| Friday, January 1, 2016 | 1603532000 | 1182276000 |
| Sunday, January 1, 2017 | 1928037000 | 1260634000 |
| Monday, January 1, 2018 | 1095014000 | 1365771000 |
| Tuesday, January 1, 2019 | 2073803000 | 1369539000 |
| Wednesday, January 1, 2020 | 3650727000 | 1324222000 |
| Friday, January 1, 2021 | 3773725000 | 1540300000 |
| Saturday, January 1, 2022 | 3778617000 | 1755000000 |
| Sunday, January 1, 2023 | 3727521000 | 1825400000 |
| Monday, January 1, 2024 | 3760116000 | 1814000000 |
In pursuit of knowledge
In the ever-evolving landscape of financial services and industrial manufacturing, cost efficiency remains a pivotal metric for success. Over the past decade, Global Payments Inc. and IDEX Corporation have showcased contrasting trajectories in their cost of revenue. From 2014 to 2023, Global Payments Inc. experienced a staggering 265% increase in cost efficiency, peaking in 2022 with a cost of revenue nearly four times that of 2014. This growth reflects the company's strategic expansions and acquisitions. Conversely, IDEX Corporation maintained a more stable cost structure, with a modest 52% increase over the same period, highlighting its consistent operational efficiency. The data reveals that while Global Payments Inc. aggressively scaled its operations, IDEX Corporation focused on steady, sustainable growth. This comparison underscores the diverse strategies companies employ to navigate their respective industries, offering valuable insights for investors and industry analysts alike.
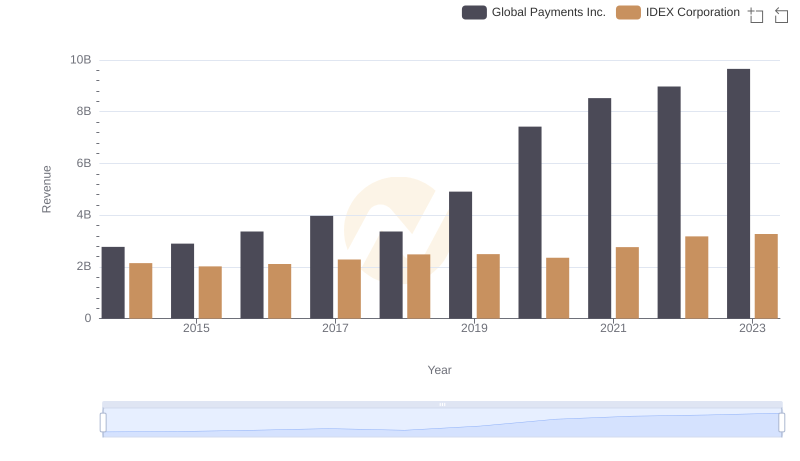
Comparing Revenue Performance: Global Payments Inc. or IDEX Corporation?
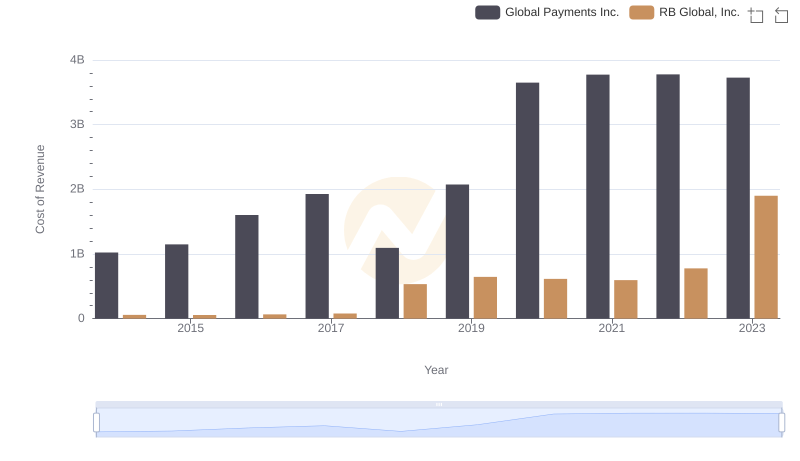
Cost of Revenue: Key Insights for Global Payments Inc. and RB Global, Inc.
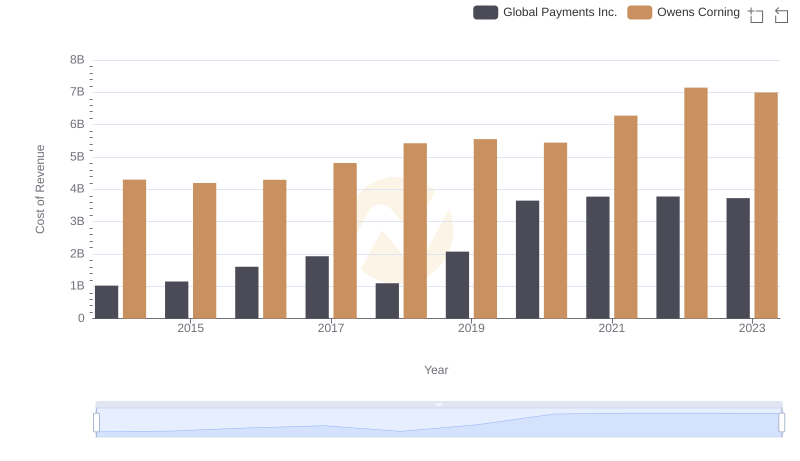
Cost of Revenue Trends: Global Payments Inc. vs Owens Corning
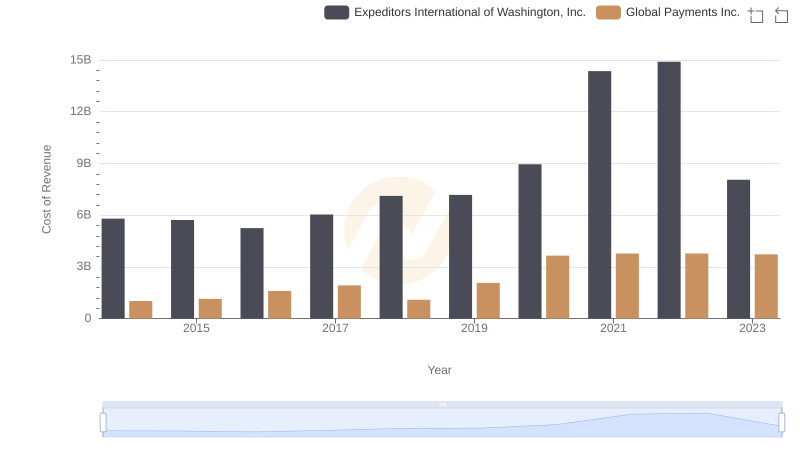
Analyzing Cost of Revenue: Global Payments Inc. and Expeditors International of Washington, Inc.
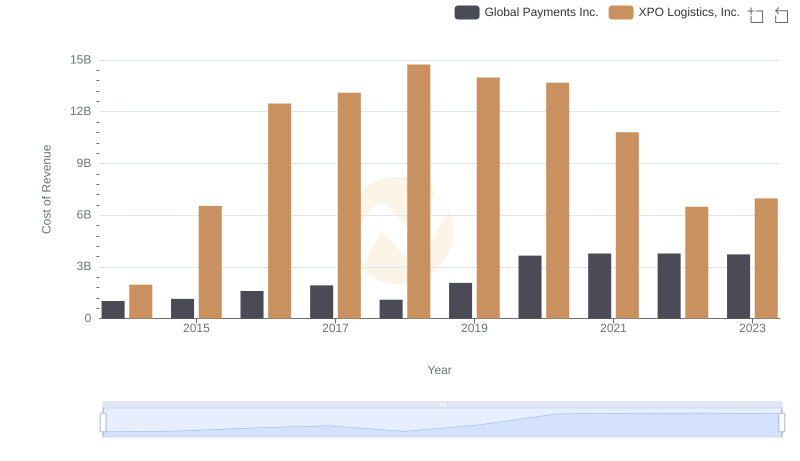
Cost of Revenue Comparison: Global Payments Inc. vs XPO Logistics, Inc.
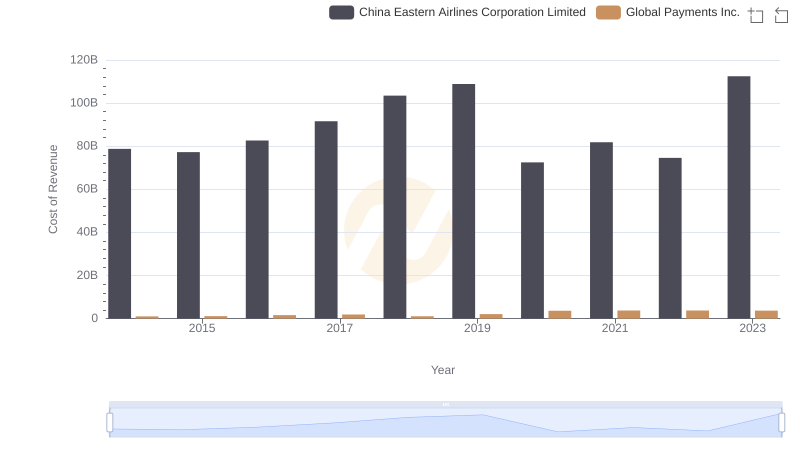
Cost of Revenue Trends: Global Payments Inc. vs China Eastern Airlines Corporation Limited
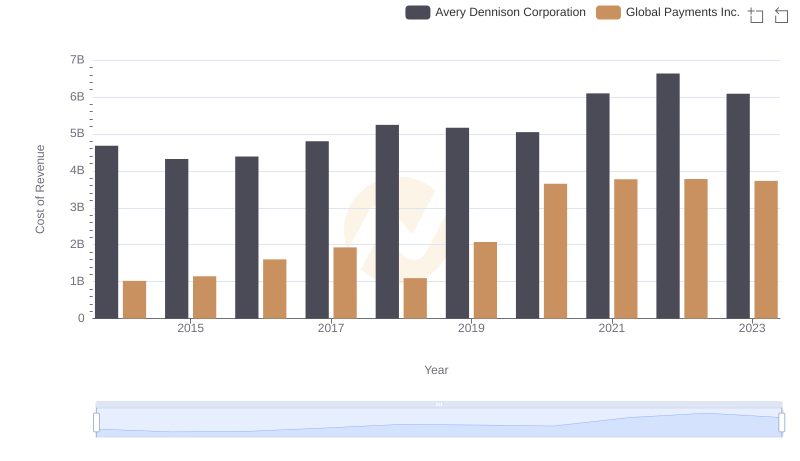
Cost of Revenue Comparison: Global Payments Inc. vs Avery Dennison Corporation
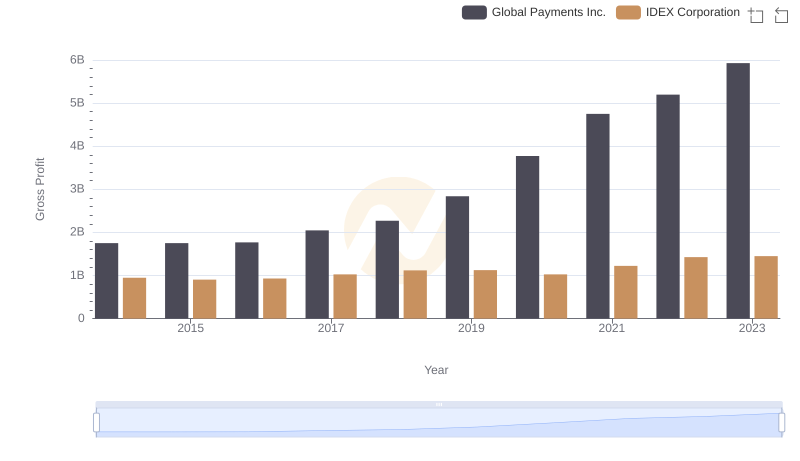
Gross Profit Comparison: Global Payments Inc. and IDEX Corporation Trends
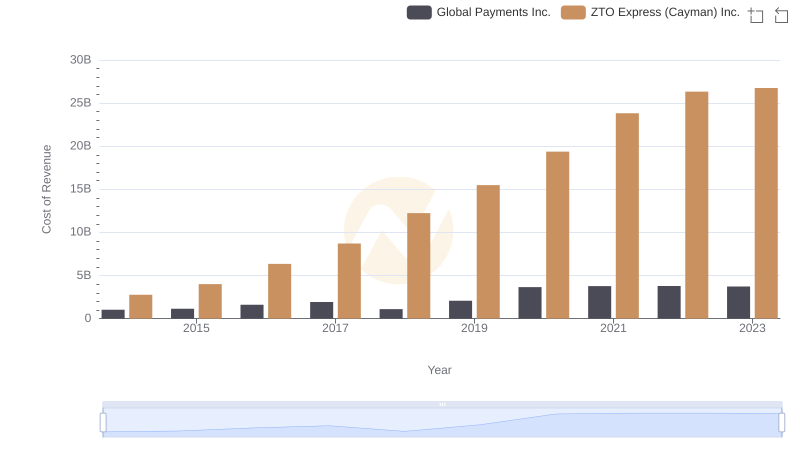
Analyzing Cost of Revenue: Global Payments Inc. and ZTO Express (Cayman) Inc.
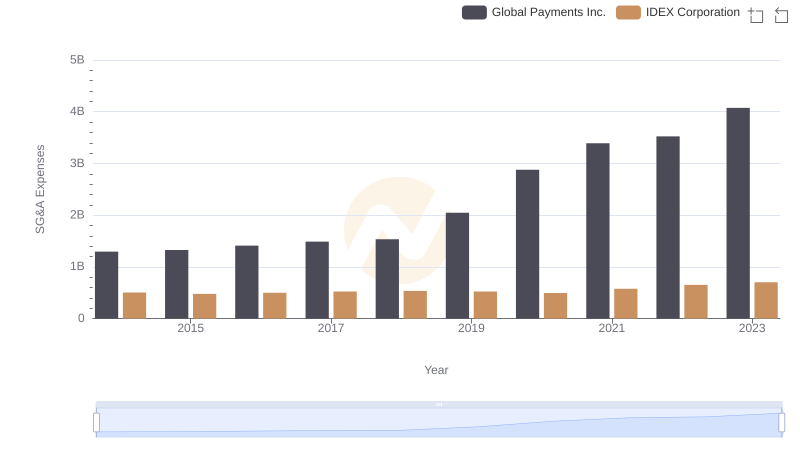
Who Optimizes SG&A Costs Better? Global Payments Inc. or IDEX Corporation
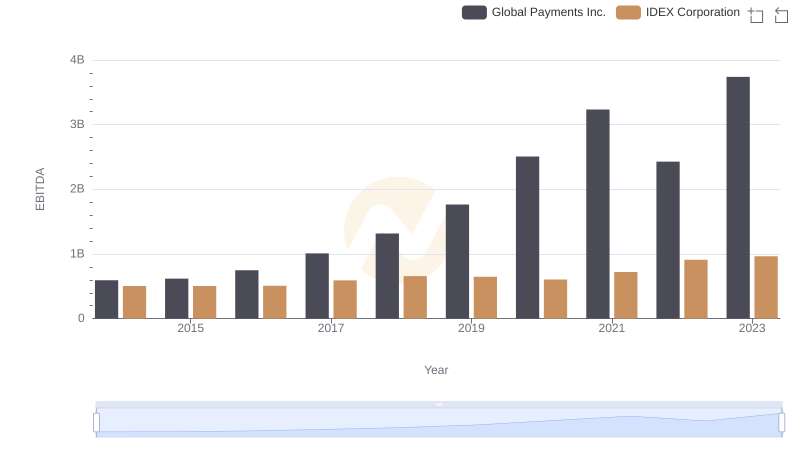
Global Payments Inc. vs IDEX Corporation: In-Depth EBITDA Performance Comparison