| __timestamp | Global Payments Inc. | XPO Logistics, Inc. |
|---|---|---|
| Wednesday, January 1, 2014 | 1022107000 | 1975000000 |
| Thursday, January 1, 2015 | 1147639000 | 6538400000 |
| Friday, January 1, 2016 | 1603532000 | 12480100000 |
| Sunday, January 1, 2017 | 1928037000 | 13101100000 |
| Monday, January 1, 2018 | 1095014000 | 14738000000 |
| Tuesday, January 1, 2019 | 2073803000 | 13982000000 |
| Wednesday, January 1, 2020 | 3650727000 | 13689000000 |
| Friday, January 1, 2021 | 3773725000 | 10812000000 |
| Saturday, January 1, 2022 | 3778617000 | 6491000000 |
| Sunday, January 1, 2023 | 3727521000 | 6974000000 |
| Monday, January 1, 2024 | 3760116000 | 7157000000 |
Igniting the spark of knowledge
In the ever-evolving landscape of global commerce, understanding the cost of revenue is crucial for evaluating a company's financial health. This comparison between Global Payments Inc. and XPO Logistics, Inc. offers a fascinating glimpse into their financial journeys from 2014 to 2023.
Global Payments Inc. has seen a steady increase in its cost of revenue, peaking in 2022 at approximately $3.78 billion. This represents a remarkable 270% growth from its 2014 figures. The company's strategic investments and expansion efforts have contributed to this upward trend, reflecting its commitment to scaling operations.
Conversely, XPO Logistics, Inc. experienced a more volatile trajectory. Starting at $1.98 billion in 2014, their cost of revenue surged to a high of $14.74 billion in 2018, before stabilizing around $6.97 billion in 2023. This fluctuation highlights the dynamic nature of the logistics industry and XPO's adaptive strategies in response to market demands.
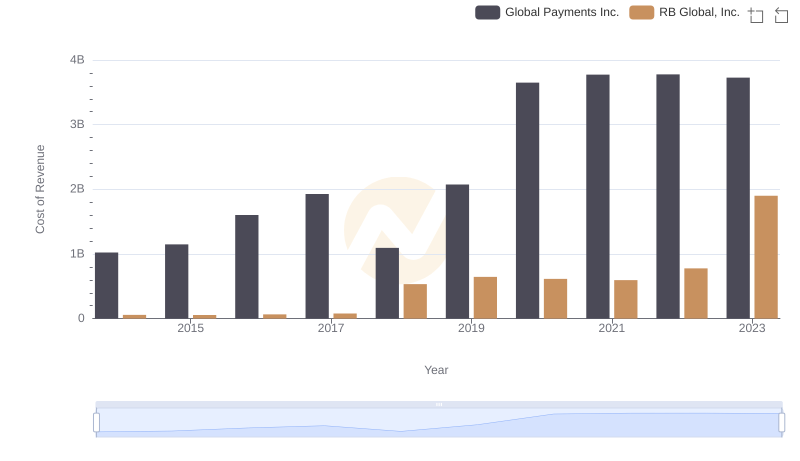
Cost of Revenue: Key Insights for Global Payments Inc. and RB Global, Inc.
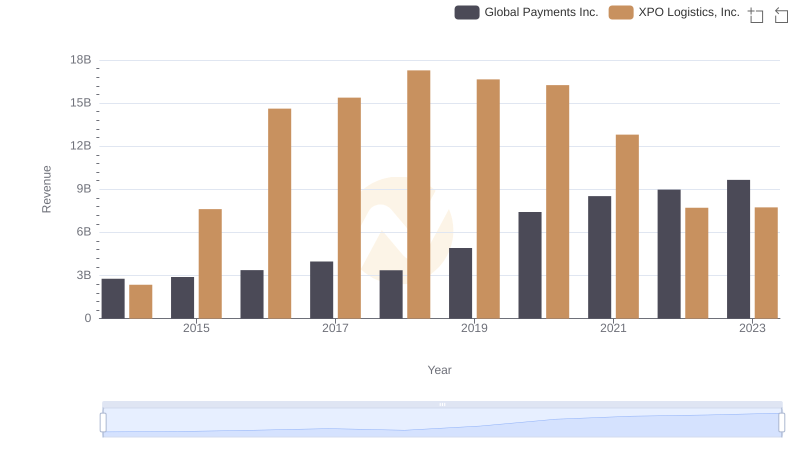
Breaking Down Revenue Trends: Global Payments Inc. vs XPO Logistics, Inc.
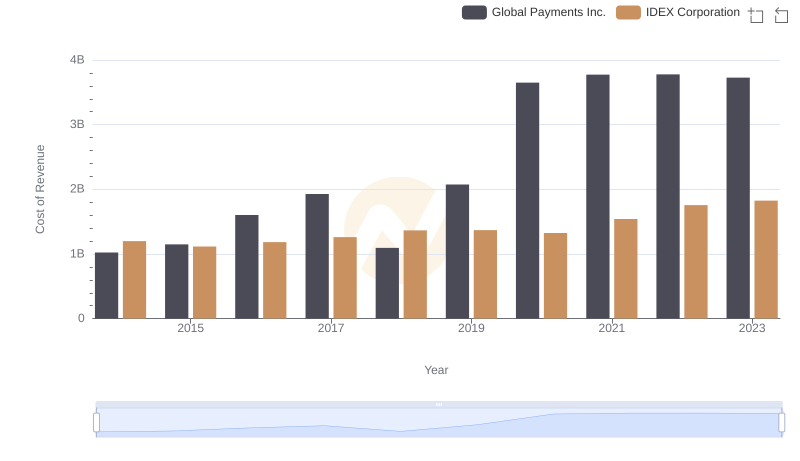
Comparing Cost of Revenue Efficiency: Global Payments Inc. vs IDEX Corporation
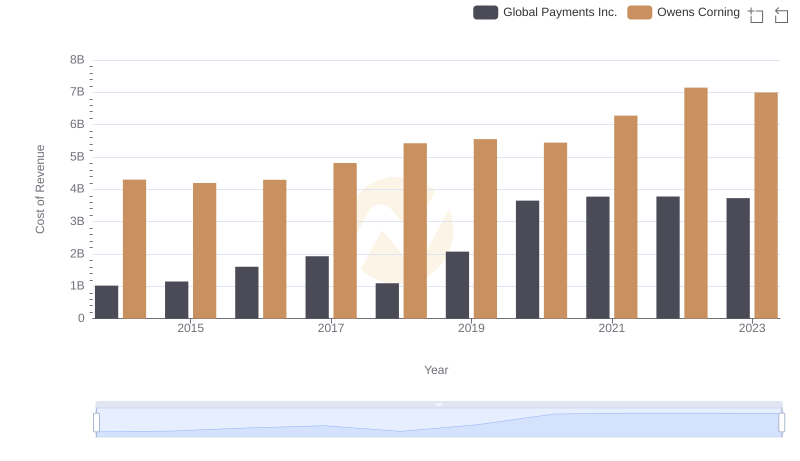
Cost of Revenue Trends: Global Payments Inc. vs Owens Corning
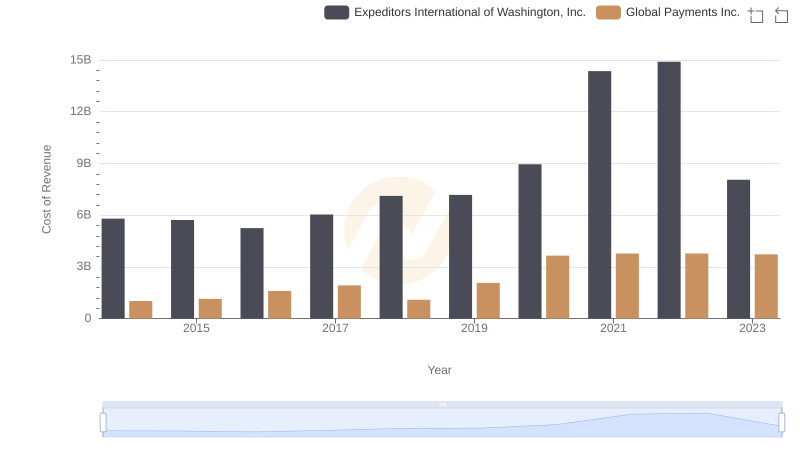
Analyzing Cost of Revenue: Global Payments Inc. and Expeditors International of Washington, Inc.
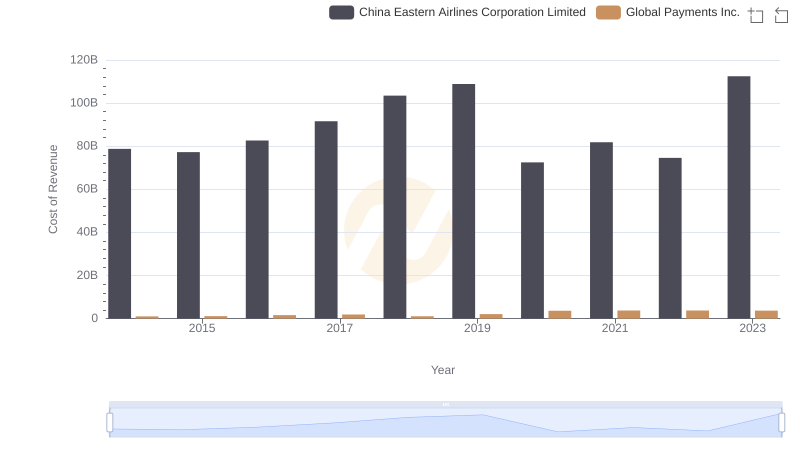
Cost of Revenue Trends: Global Payments Inc. vs China Eastern Airlines Corporation Limited
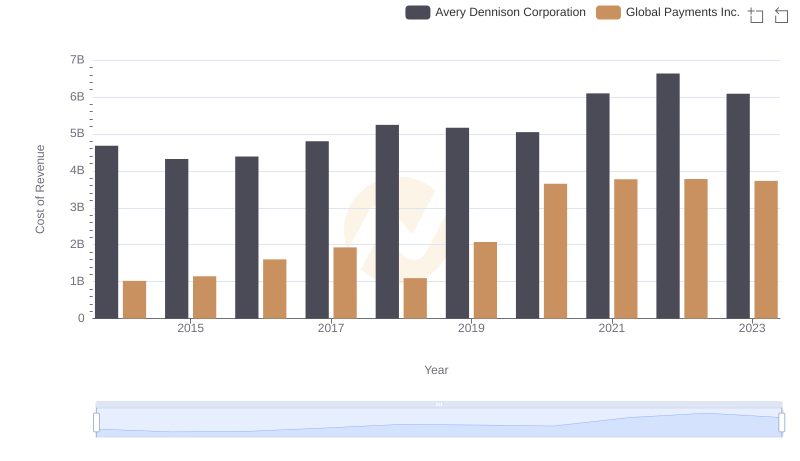
Cost of Revenue Comparison: Global Payments Inc. vs Avery Dennison Corporation
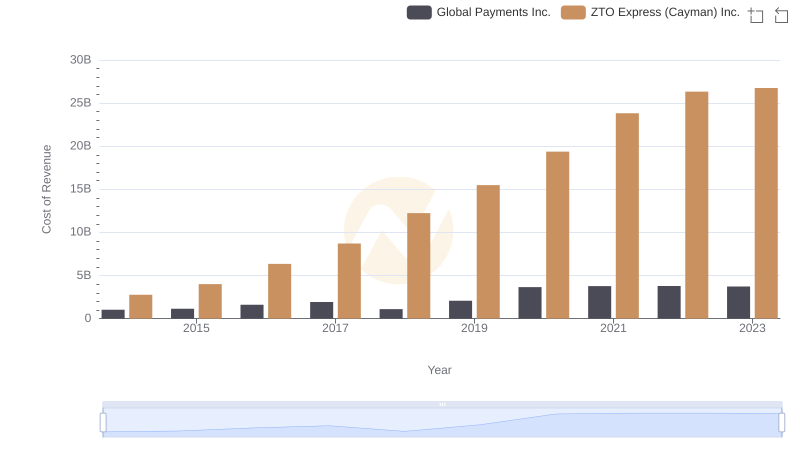
Analyzing Cost of Revenue: Global Payments Inc. and ZTO Express (Cayman) Inc.
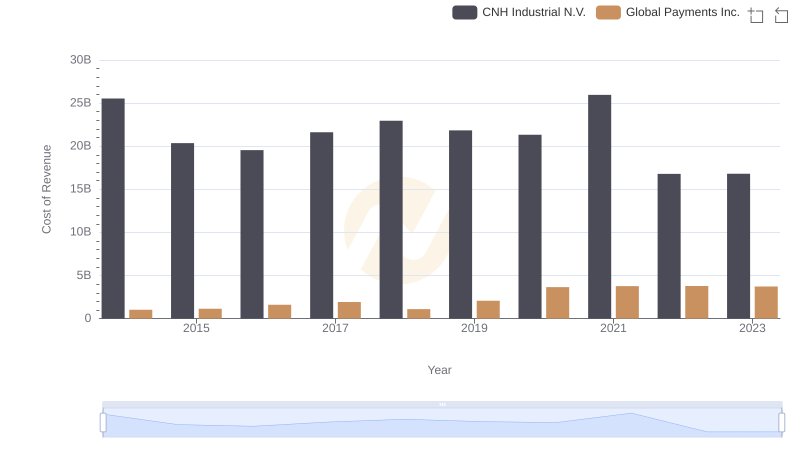
Cost of Revenue Comparison: Global Payments Inc. vs CNH Industrial N.V.
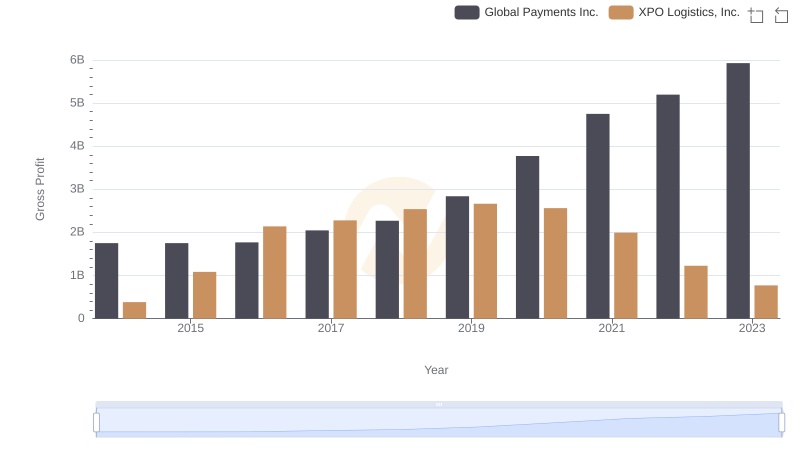
Gross Profit Analysis: Comparing Global Payments Inc. and XPO Logistics, Inc.
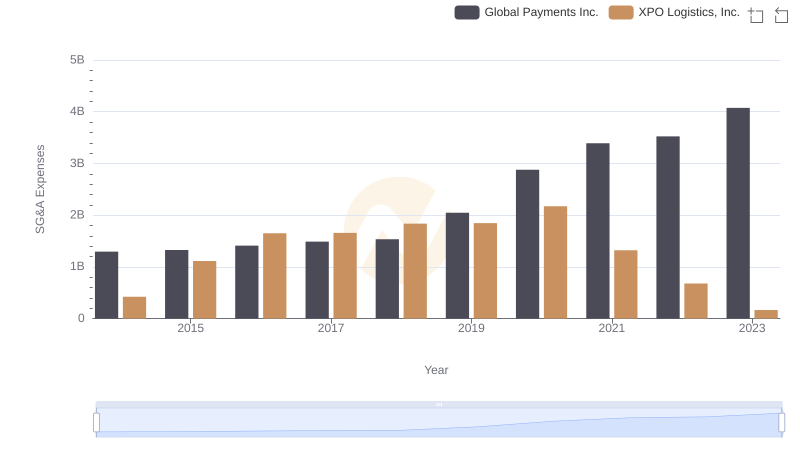
SG&A Efficiency Analysis: Comparing Global Payments Inc. and XPO Logistics, Inc.

Comprehensive EBITDA Comparison: Global Payments Inc. vs XPO Logistics, Inc.