| __timestamp | EMCOR Group, Inc. | J.B. Hunt Transport Services, Inc. |
|---|---|---|
| Wednesday, January 1, 2014 | 5517719000 | 5124095000 |
| Thursday, January 1, 2015 | 5774247000 | 5041472000 |
| Friday, January 1, 2016 | 6513662000 | 5369826000 |
| Sunday, January 1, 2017 | 6539987000 | 5990275000 |
| Monday, January 1, 2018 | 6925178000 | 7255657000 |
| Tuesday, January 1, 2019 | 7818743000 | 7659003000 |
| Wednesday, January 1, 2020 | 7401679000 | 8186697000 |
| Friday, January 1, 2021 | 8401843000 | 10298483000 |
| Saturday, January 1, 2022 | 9472526000 | 12341472000 |
| Sunday, January 1, 2023 | 10493534000 | 10433277000 |
Unlocking the unknown
In the ever-evolving landscape of American industry, understanding the cost of revenue is crucial for evaluating a company's operational efficiency. Over the past decade, EMCOR Group, Inc. and J.B. Hunt Transport Services, Inc. have demonstrated intriguing trends in their cost structures. From 2014 to 2023, EMCOR's cost of revenue increased by approximately 90%, reflecting its strategic expansion and operational scaling. Meanwhile, J.B. Hunt saw a similar rise of about 104%, indicating robust growth in the transportation sector.
By 2023, both companies reported costs exceeding $10 billion, with J.B. Hunt slightly ahead. This data underscores the competitive nature of these industries and highlights the importance of cost management in maintaining profitability. As these giants continue to grow, stakeholders must keep a keen eye on these financial metrics to gauge future performance.
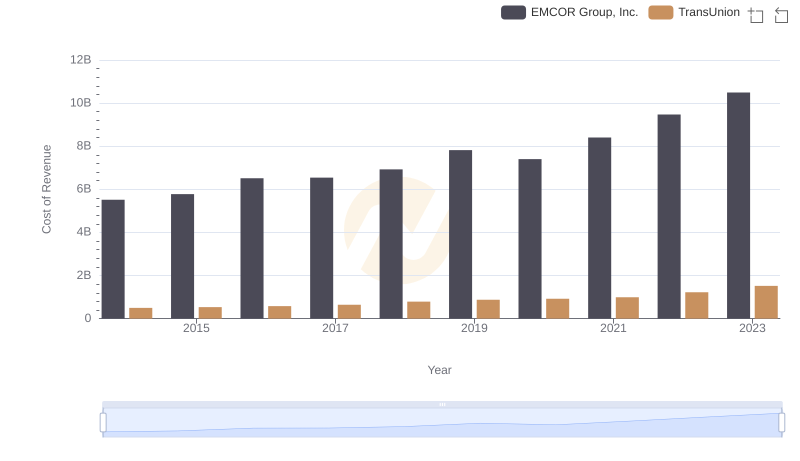
Cost of Revenue Trends: EMCOR Group, Inc. vs TransUnion
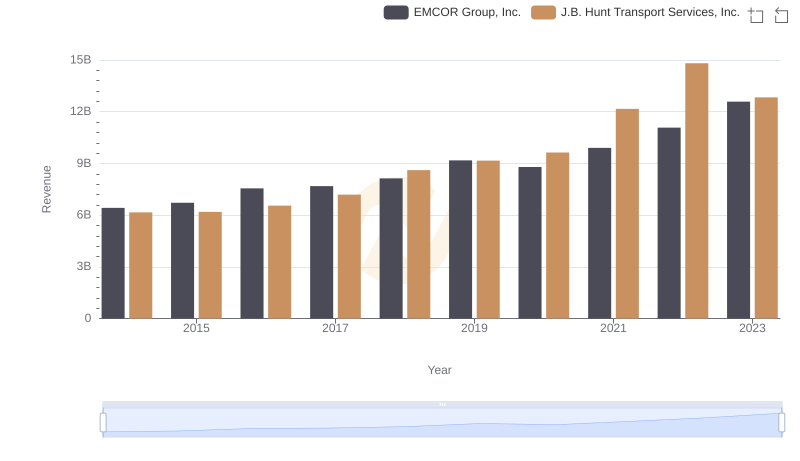
Annual Revenue Comparison: EMCOR Group, Inc. vs J.B. Hunt Transport Services, Inc.
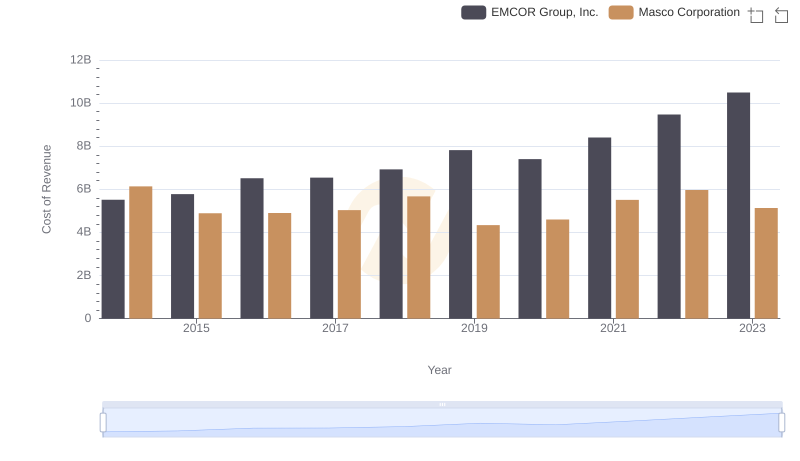
Cost of Revenue: Key Insights for EMCOR Group, Inc. and Masco Corporation
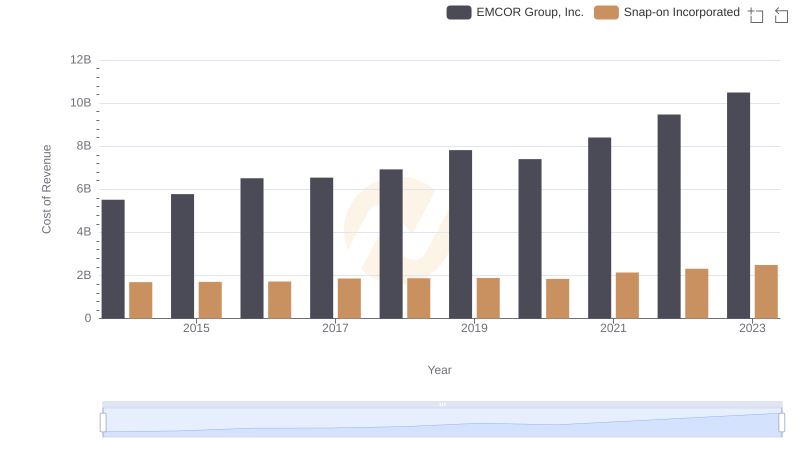
Cost of Revenue Comparison: EMCOR Group, Inc. vs Snap-on Incorporated
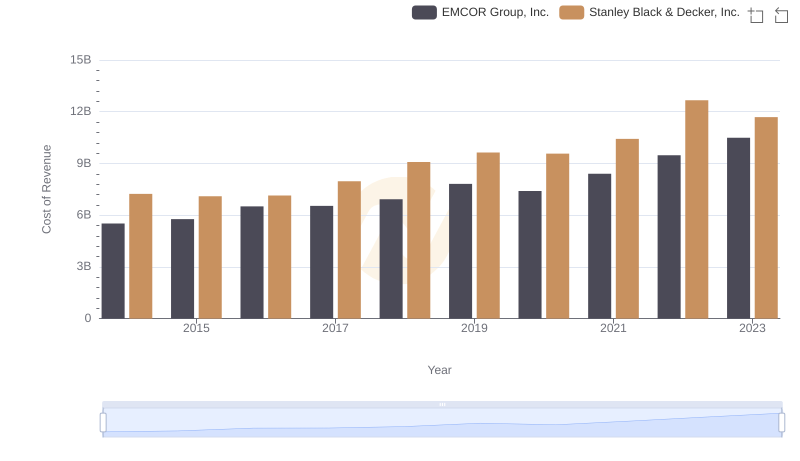
Cost of Revenue Trends: EMCOR Group, Inc. vs Stanley Black & Decker, Inc.
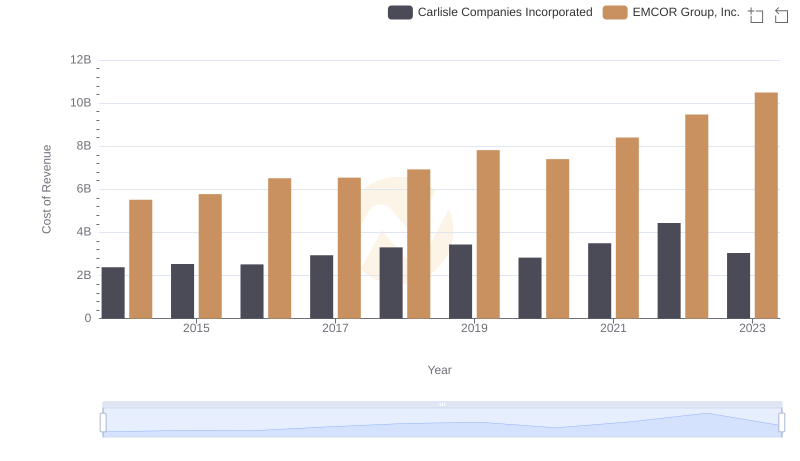
Comparing Cost of Revenue Efficiency: EMCOR Group, Inc. vs Carlisle Companies Incorporated
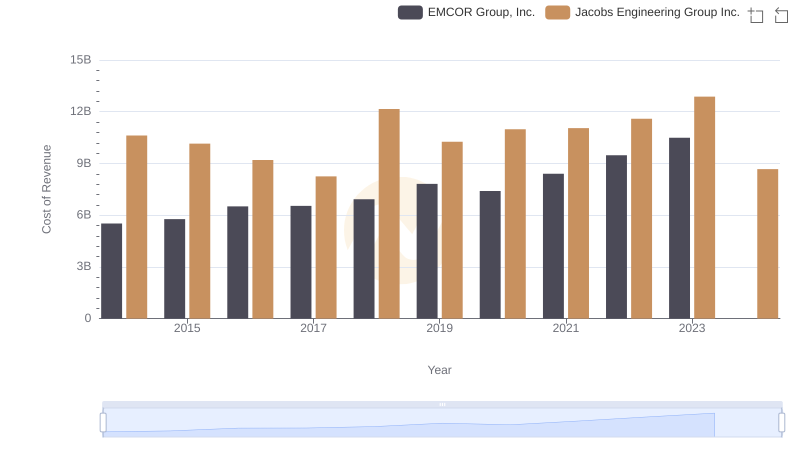
EMCOR Group, Inc. vs Jacobs Engineering Group Inc.: Efficiency in Cost of Revenue Explored
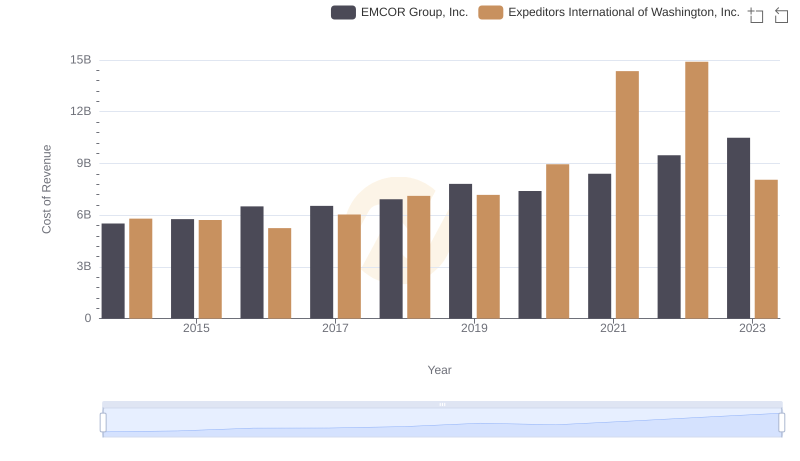
Cost of Revenue: Key Insights for EMCOR Group, Inc. and Expeditors International of Washington, Inc.
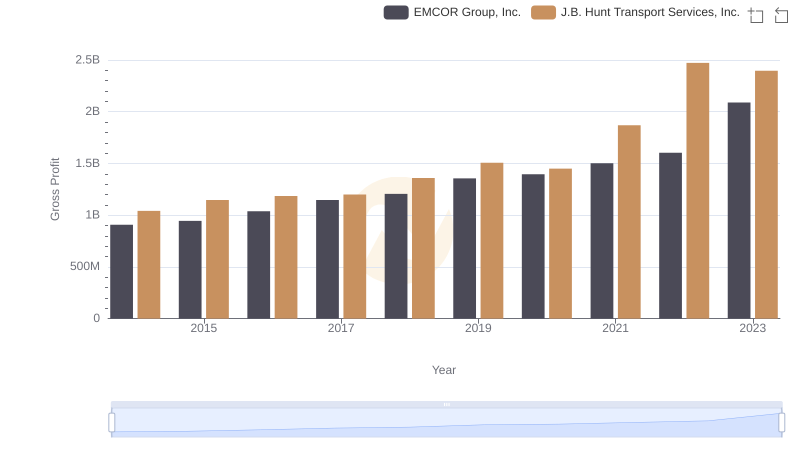
Gross Profit Trends Compared: EMCOR Group, Inc. vs J.B. Hunt Transport Services, Inc.

Breaking Down SG&A Expenses: EMCOR Group, Inc. vs J.B. Hunt Transport Services, Inc.
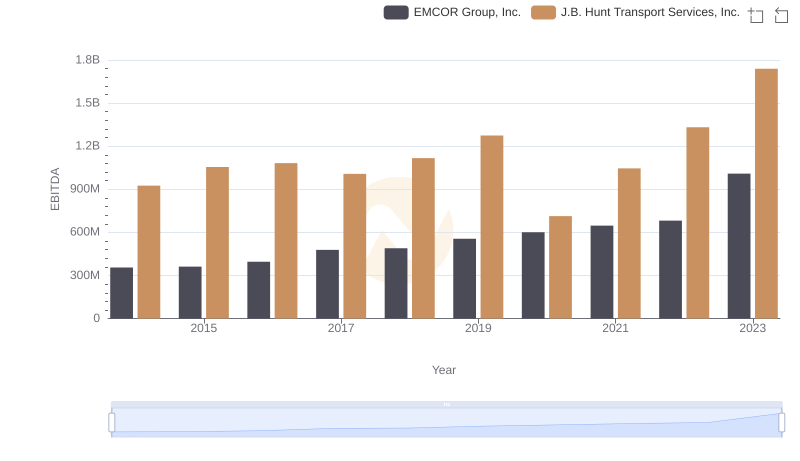
Comparative EBITDA Analysis: EMCOR Group, Inc. vs J.B. Hunt Transport Services, Inc.