| __timestamp | EMCOR Group, Inc. | TransUnion |
|---|---|---|
| Wednesday, January 1, 2014 | 5517719000 | 499100000 |
| Thursday, January 1, 2015 | 5774247000 | 531600000 |
| Friday, January 1, 2016 | 6513662000 | 579100000 |
| Sunday, January 1, 2017 | 6539987000 | 645700000 |
| Monday, January 1, 2018 | 6925178000 | 790100000 |
| Tuesday, January 1, 2019 | 7818743000 | 874100000 |
| Wednesday, January 1, 2020 | 7401679000 | 920400000 |
| Friday, January 1, 2021 | 8401843000 | 991600000 |
| Saturday, January 1, 2022 | 9472526000 | 1222900000 |
| Sunday, January 1, 2023 | 10493534000 | 1517300000 |
| Monday, January 1, 2024 | 0 |
Data in motion
In the ever-evolving landscape of corporate finance, understanding cost structures is crucial. This analysis delves into the cost of revenue trends for EMCOR Group, Inc. and TransUnion from 2014 to 2023. Over this period, EMCOR Group, Inc. has seen a steady increase in its cost of revenue, growing by approximately 90% from 2014 to 2023. This reflects its expanding operations and market presence. In contrast, TransUnion's cost of revenue has increased by about 200%, indicating a significant scaling of its business activities.
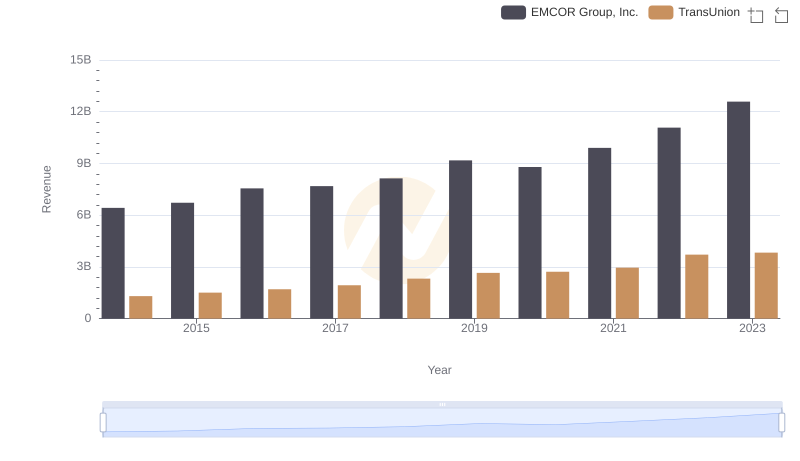
Revenue Insights: EMCOR Group, Inc. and TransUnion Performance Compared
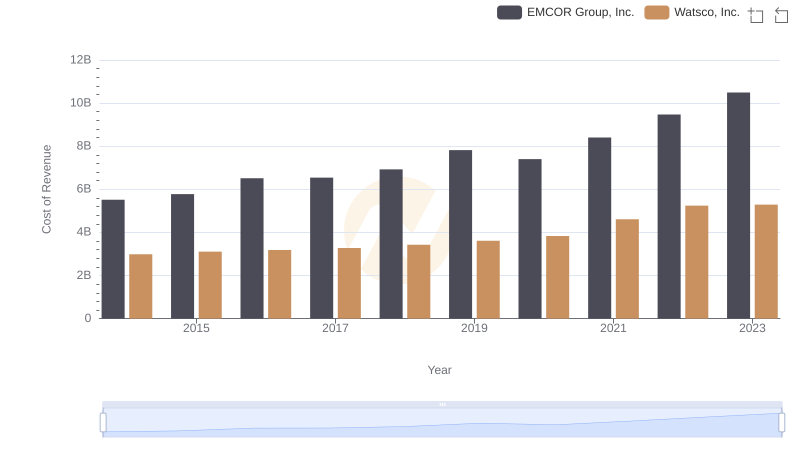
Cost Insights: Breaking Down EMCOR Group, Inc. and Watsco, Inc.'s Expenses
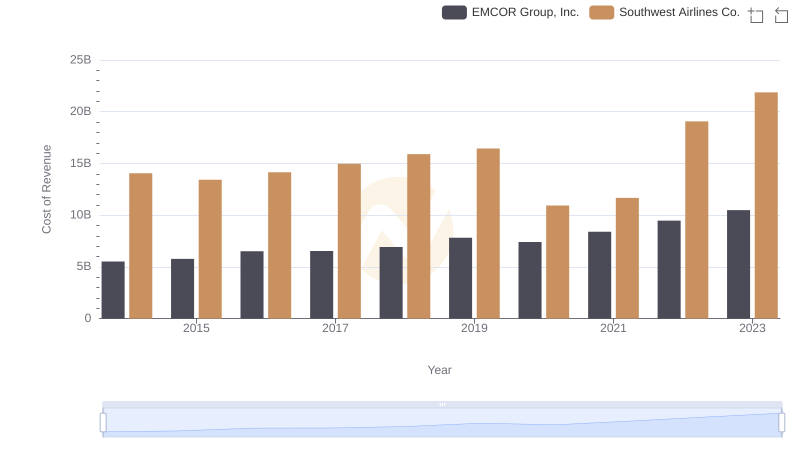
Analyzing Cost of Revenue: EMCOR Group, Inc. and Southwest Airlines Co.
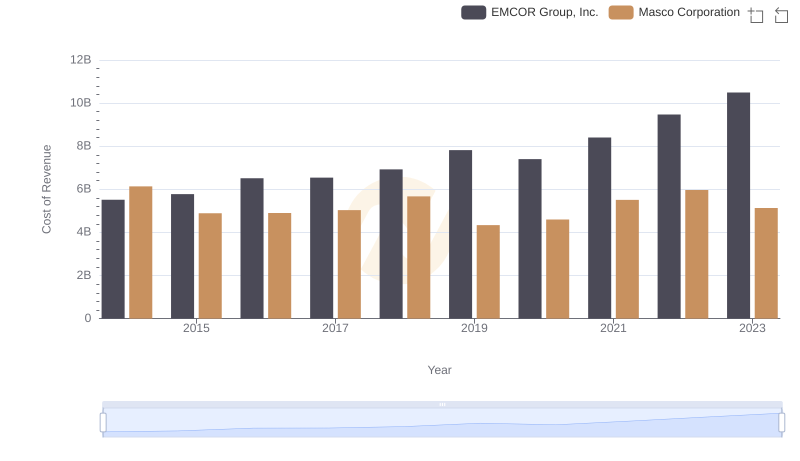
Cost of Revenue: Key Insights for EMCOR Group, Inc. and Masco Corporation
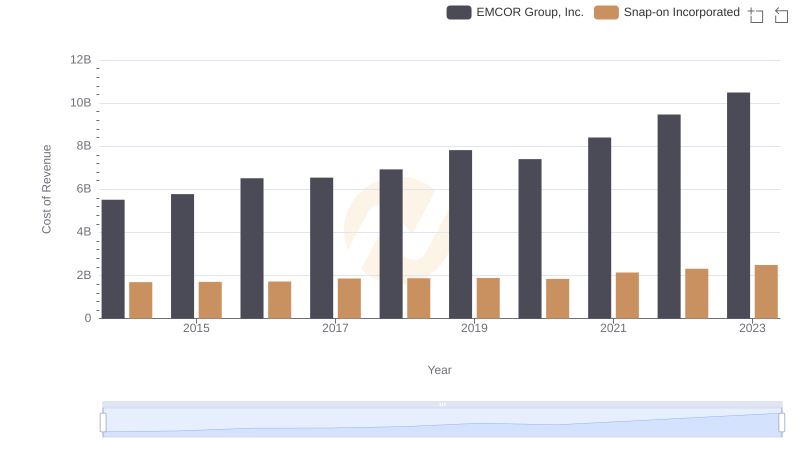
Cost of Revenue Comparison: EMCOR Group, Inc. vs Snap-on Incorporated
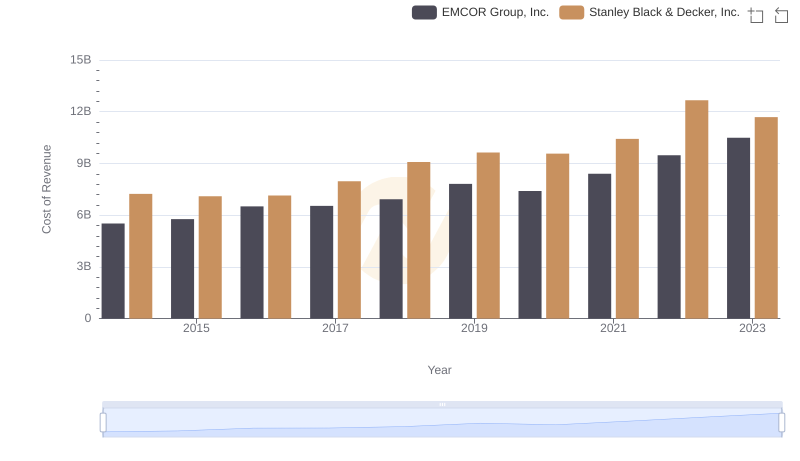
Cost of Revenue Trends: EMCOR Group, Inc. vs Stanley Black & Decker, Inc.
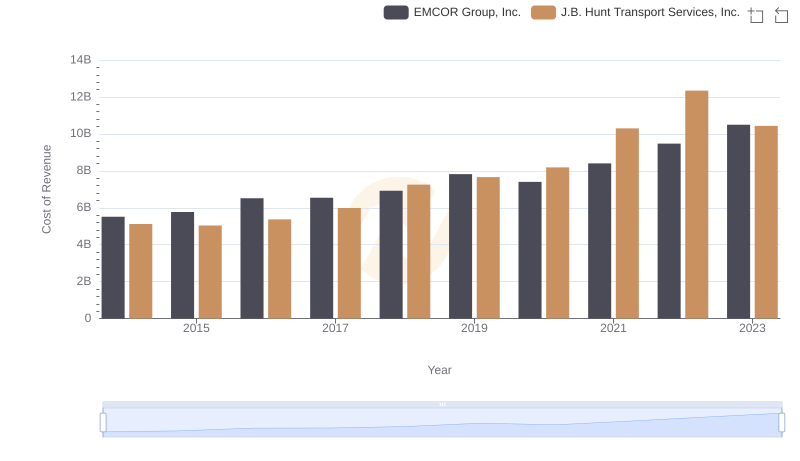
Cost of Revenue: Key Insights for EMCOR Group, Inc. and J.B. Hunt Transport Services, Inc.
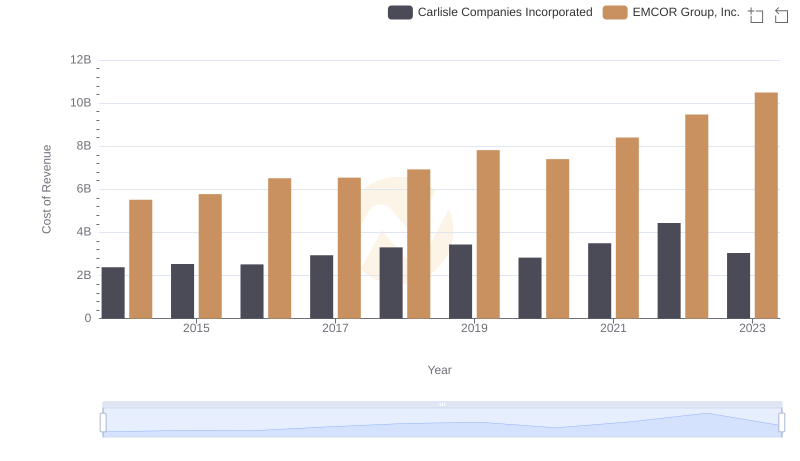
Comparing Cost of Revenue Efficiency: EMCOR Group, Inc. vs Carlisle Companies Incorporated
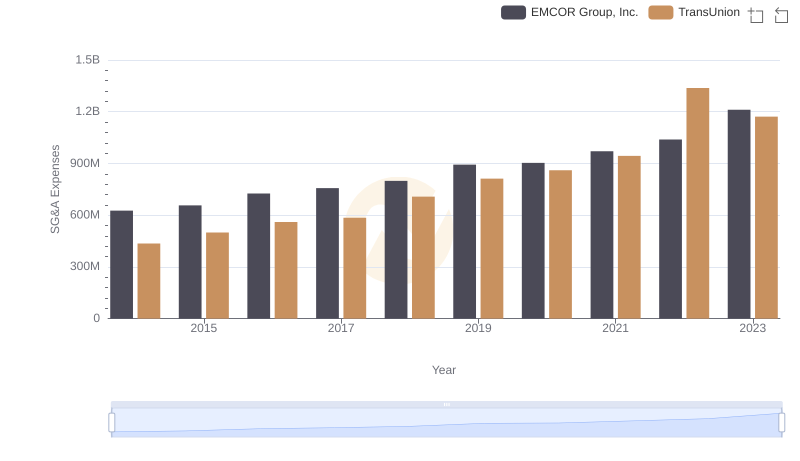
EMCOR Group, Inc. vs TransUnion: SG&A Expense Trends
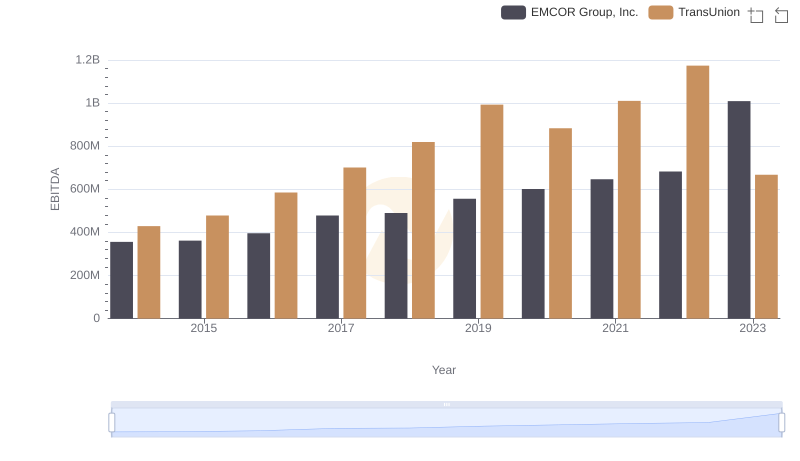
Comprehensive EBITDA Comparison: EMCOR Group, Inc. vs TransUnion