| __timestamp | EMCOR Group, Inc. | Stanley Black & Decker, Inc. |
|---|---|---|
| Wednesday, January 1, 2014 | 5517719000 | 7235900000 |
| Thursday, January 1, 2015 | 5774247000 | 7099800000 |
| Friday, January 1, 2016 | 6513662000 | 7139700000 |
| Sunday, January 1, 2017 | 6539987000 | 7969200000 |
| Monday, January 1, 2018 | 6925178000 | 9080500000 |
| Tuesday, January 1, 2019 | 7818743000 | 9636700000 |
| Wednesday, January 1, 2020 | 7401679000 | 9566700000 |
| Friday, January 1, 2021 | 8401843000 | 10423000000 |
| Saturday, January 1, 2022 | 9472526000 | 12663300000 |
| Sunday, January 1, 2023 | 10493534000 | 11683100000 |
| Monday, January 1, 2024 | 10851300000 |
In pursuit of knowledge
In the ever-evolving landscape of industrial services and tools, EMCOR Group, Inc. and Stanley Black & Decker, Inc. have showcased intriguing cost of revenue trends over the past decade. From 2014 to 2023, EMCOR Group's cost of revenue surged by approximately 90%, reflecting its strategic expansion and operational efficiency. Meanwhile, Stanley Black & Decker experienced a 61% increase, underscoring its robust market presence and innovation-driven growth.
In 2014, EMCOR's cost of revenue was about 24% lower than Stanley Black & Decker's. However, by 2023, EMCOR closed this gap significantly, with its cost of revenue reaching nearly 90% of Stanley Black & Decker's. This shift highlights EMCOR's aggressive growth strategy and market adaptation.
These trends offer a fascinating glimpse into the financial strategies of two industry leaders, each navigating their unique paths to success.

Annual Revenue Comparison: EMCOR Group, Inc. vs Stanley Black & Decker, Inc.
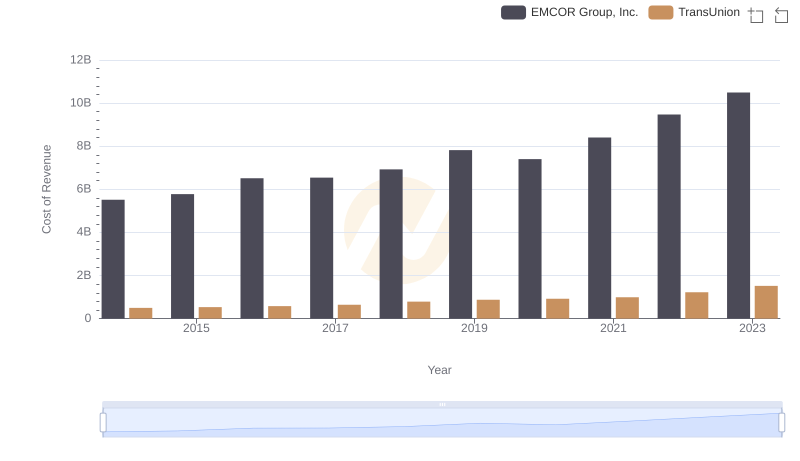
Cost of Revenue Trends: EMCOR Group, Inc. vs TransUnion
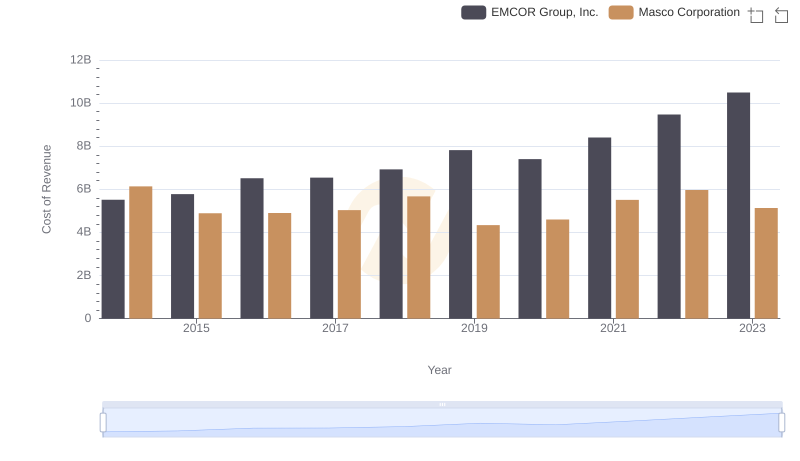
Cost of Revenue: Key Insights for EMCOR Group, Inc. and Masco Corporation
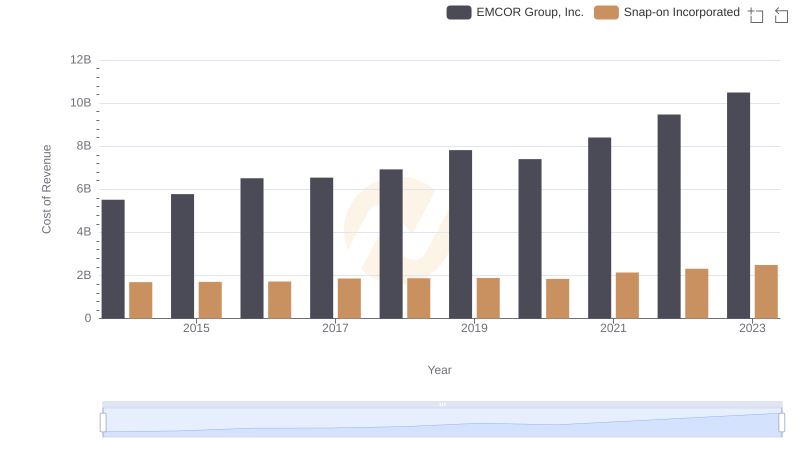
Cost of Revenue Comparison: EMCOR Group, Inc. vs Snap-on Incorporated
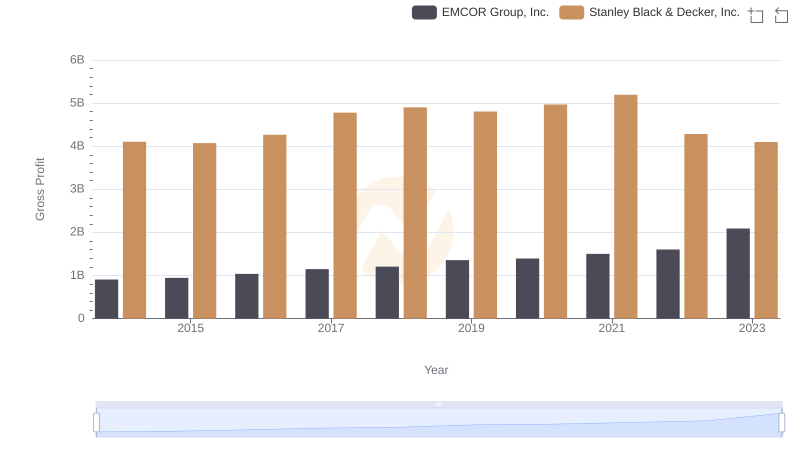
Key Insights on Gross Profit: EMCOR Group, Inc. vs Stanley Black & Decker, Inc.

A Professional Review of EBITDA: EMCOR Group, Inc. Compared to Stanley Black & Decker, Inc.
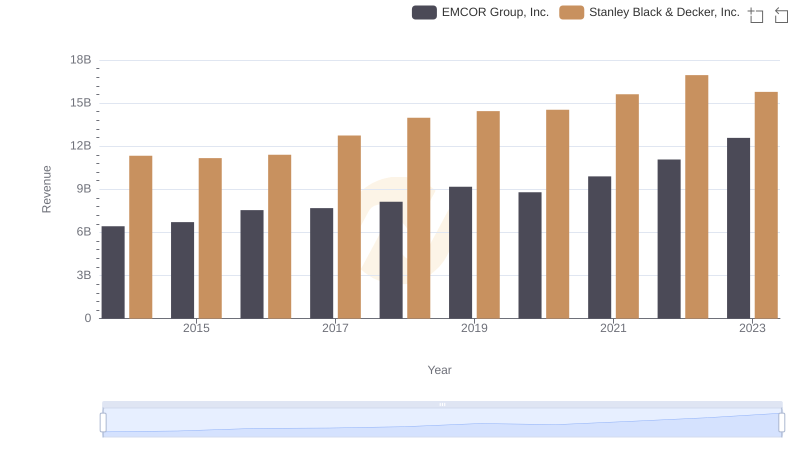
EMCOR Group, Inc. or Stanley Black & Decker, Inc.: Who Leads in Yearly Revenue?
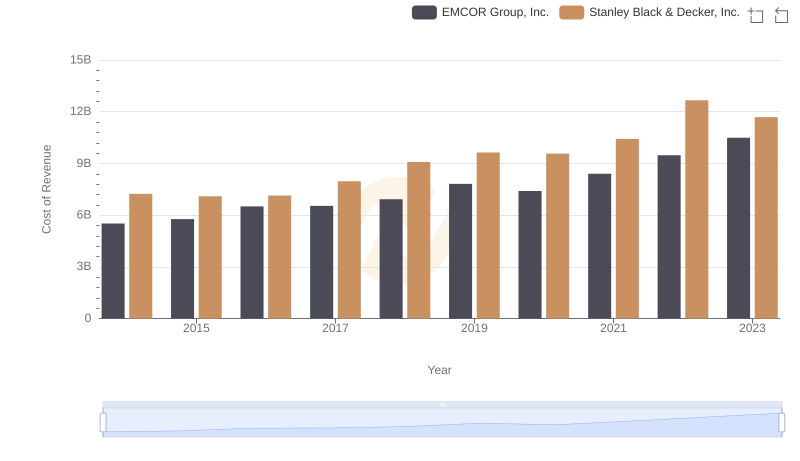
Cost of Revenue: Key Insights for EMCOR Group, Inc. and Stanley Black & Decker, Inc.

Gross Profit Comparison: EMCOR Group, Inc. and Stanley Black & Decker, Inc. Trends
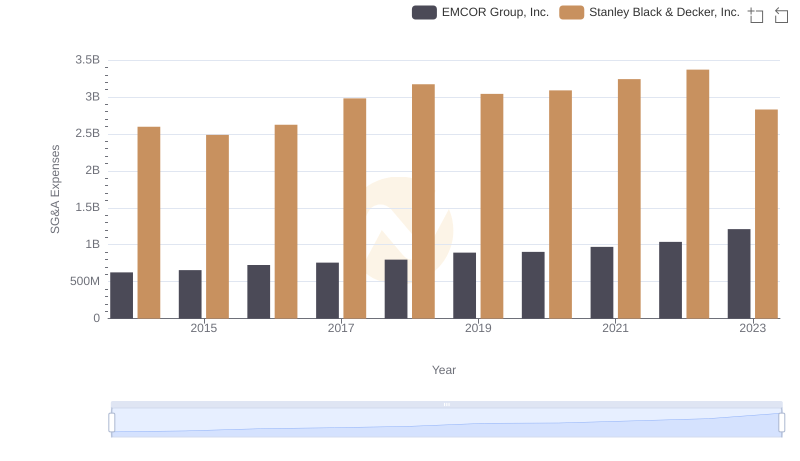
Selling, General, and Administrative Costs: EMCOR Group, Inc. vs Stanley Black & Decker, Inc.
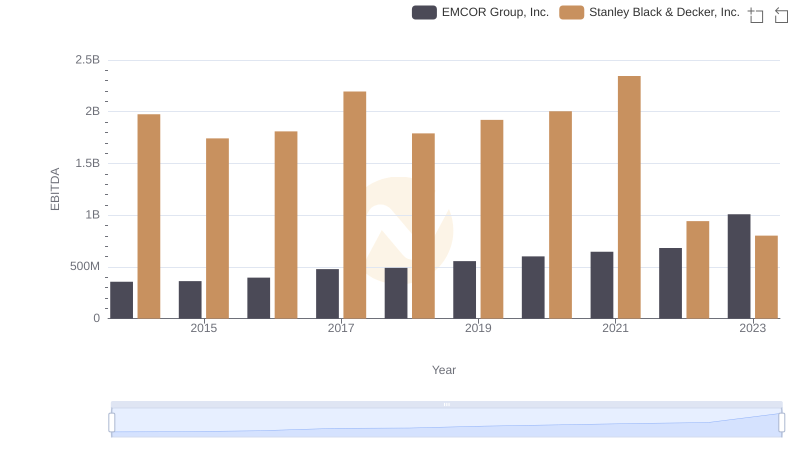
EMCOR Group, Inc. and Stanley Black & Decker, Inc.: A Detailed Examination of EBITDA Performance