| __timestamp | EMCOR Group, Inc. | Jacobs Engineering Group Inc. |
|---|---|---|
| Wednesday, January 1, 2014 | 5517719000 | 10621373000 |
| Thursday, January 1, 2015 | 5774247000 | 10146494000 |
| Friday, January 1, 2016 | 6513662000 | 9196326000 |
| Sunday, January 1, 2017 | 6539987000 | 8250536000 |
| Monday, January 1, 2018 | 6925178000 | 12156276000 |
| Tuesday, January 1, 2019 | 7818743000 | 10260840000 |
| Wednesday, January 1, 2020 | 7401679000 | 10980307000 |
| Friday, January 1, 2021 | 8401843000 | 11048860000 |
| Saturday, January 1, 2022 | 9472526000 | 11595785000 |
| Sunday, January 1, 2023 | 10493534000 | 12879099000 |
| Monday, January 1, 2024 | 8668185000 |
In pursuit of knowledge
In the competitive landscape of engineering and construction, cost efficiency is paramount. Over the past decade, EMCOR Group, Inc. and Jacobs Engineering Group Inc. have demonstrated distinct trends in managing their cost of revenue. From 2014 to 2023, EMCOR's cost of revenue surged by approximately 90%, reflecting a strategic expansion and increased operational scale. In contrast, Jacobs Engineering experienced a more modest increase of around 21% during the same period, indicating a focus on optimizing existing operations.
Interestingly, 2023 marked a peak for both companies, with EMCOR reaching its highest cost of revenue, while Jacobs Engineering also saw a significant rise. However, data for 2024 is incomplete, leaving room for speculation on future trends. This analysis underscores the dynamic nature of cost management strategies in the engineering sector, offering valuable insights for investors and industry analysts alike.
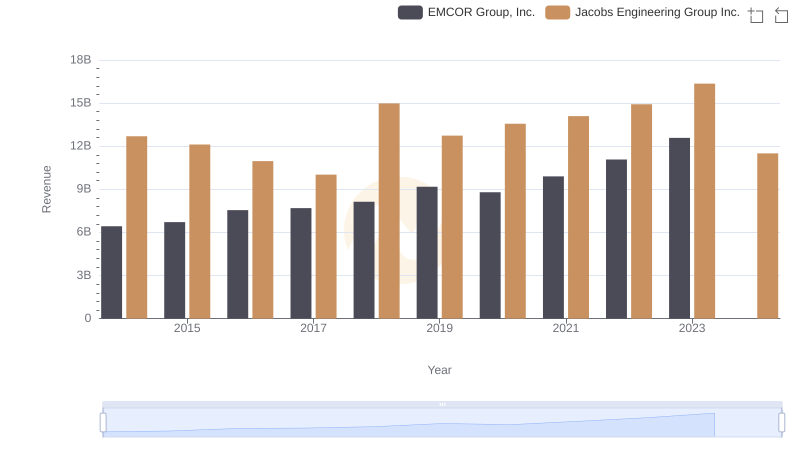
EMCOR Group, Inc. vs Jacobs Engineering Group Inc.: Examining Key Revenue Metrics
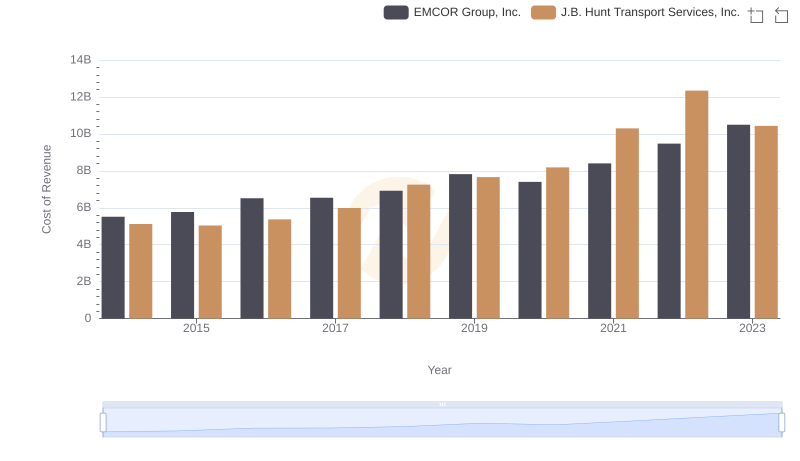
Cost of Revenue: Key Insights for EMCOR Group, Inc. and J.B. Hunt Transport Services, Inc.
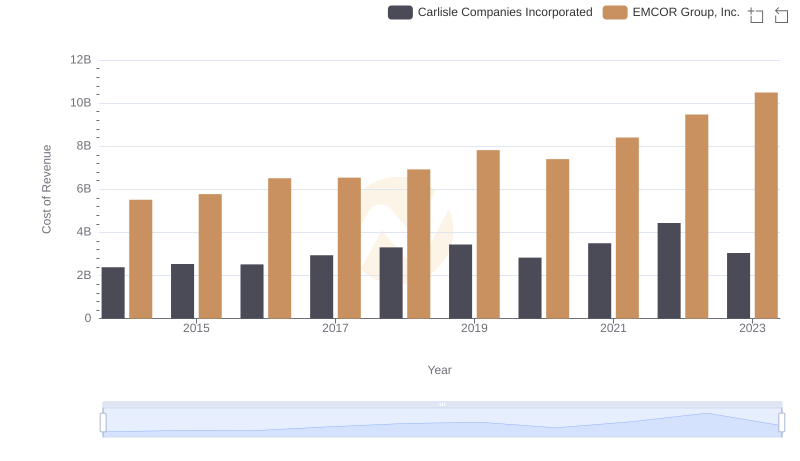
Comparing Cost of Revenue Efficiency: EMCOR Group, Inc. vs Carlisle Companies Incorporated
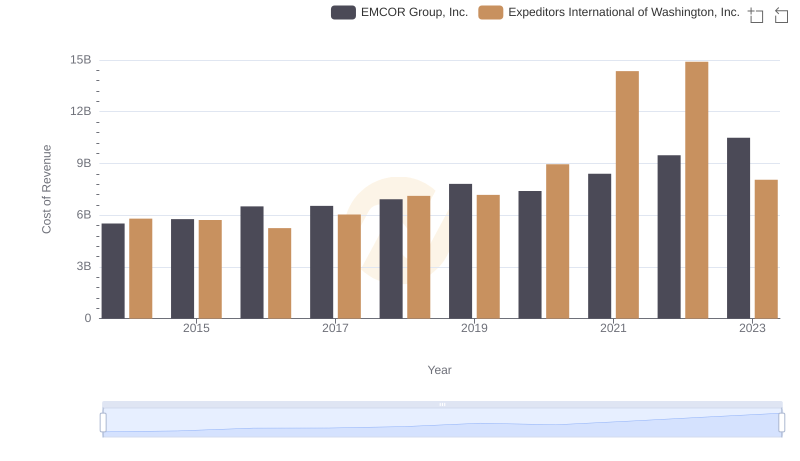
Cost of Revenue: Key Insights for EMCOR Group, Inc. and Expeditors International of Washington, Inc.
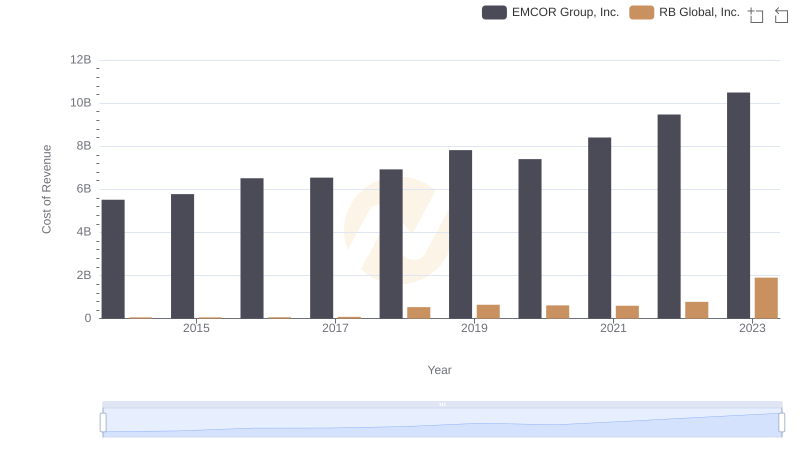
EMCOR Group, Inc. vs RB Global, Inc.: Efficiency in Cost of Revenue Explored
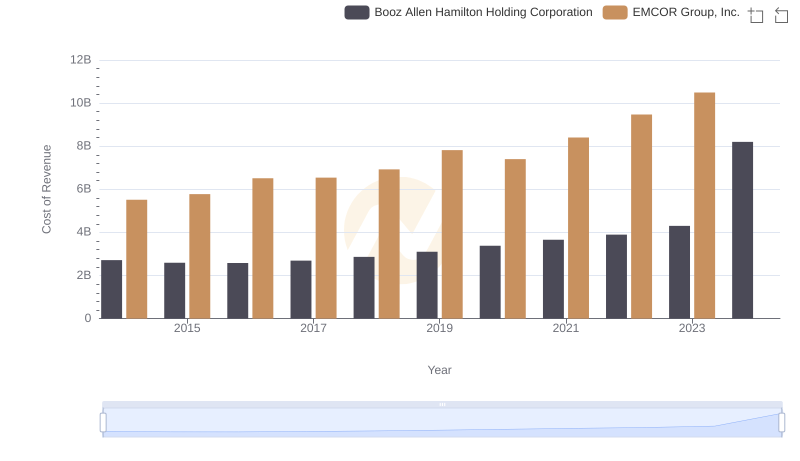
Cost of Revenue Trends: EMCOR Group, Inc. vs Booz Allen Hamilton Holding Corporation
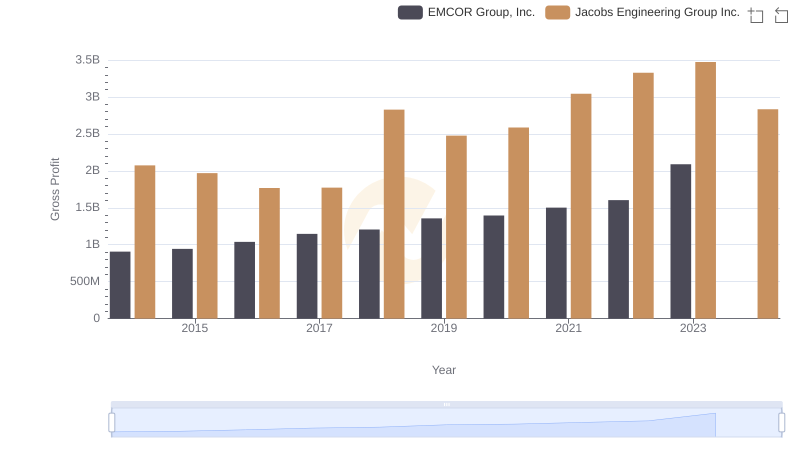
Who Generates Higher Gross Profit? EMCOR Group, Inc. or Jacobs Engineering Group Inc.
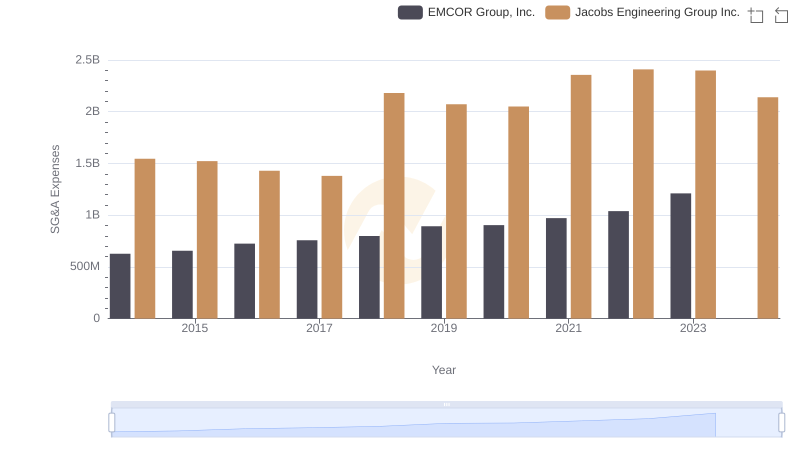
Selling, General, and Administrative Costs: EMCOR Group, Inc. vs Jacobs Engineering Group Inc.
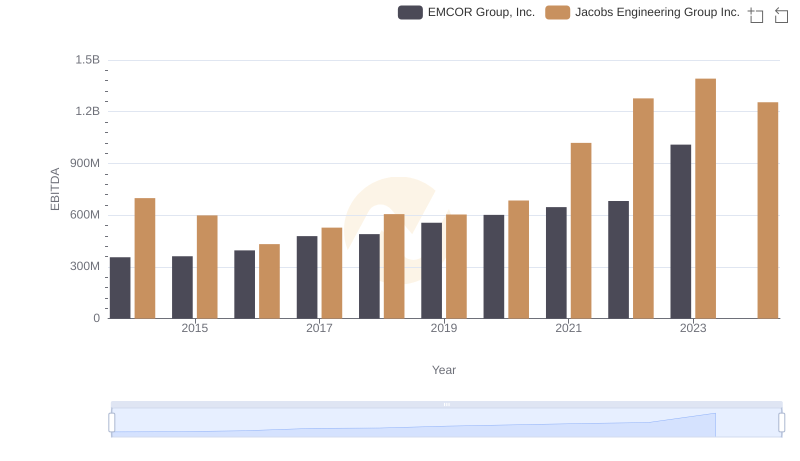
Comparative EBITDA Analysis: EMCOR Group, Inc. vs Jacobs Engineering Group Inc.