| __timestamp | EMCOR Group, Inc. | Snap-on Incorporated |
|---|---|---|
| Wednesday, January 1, 2014 | 5517719000 | 1693400000 |
| Thursday, January 1, 2015 | 5774247000 | 1704500000 |
| Friday, January 1, 2016 | 6513662000 | 1720800000 |
| Sunday, January 1, 2017 | 6539987000 | 1862000000 |
| Monday, January 1, 2018 | 6925178000 | 1870700000 |
| Tuesday, January 1, 2019 | 7818743000 | 1886000000 |
| Wednesday, January 1, 2020 | 7401679000 | 1844000000 |
| Friday, January 1, 2021 | 8401843000 | 2141200000 |
| Saturday, January 1, 2022 | 9472526000 | 2311700000 |
| Sunday, January 1, 2023 | 10493534000 | 2488500000 |
| Monday, January 1, 2024 | 2329500000 |
Data in motion
In the competitive landscape of industrial services and tools, EMCOR Group, Inc. and Snap-on Incorporated have carved distinct paths. Over the past decade, EMCOR's cost of revenue has surged by approximately 90%, reflecting its expansive growth and operational scale. In contrast, Snap-on's cost of revenue has increased by about 47%, showcasing its steady yet robust market presence.
From 2014 to 2023, EMCOR consistently outpaced Snap-on, with its cost of revenue peaking at over four times that of Snap-on by 2023. This trend underscores EMCOR's aggressive expansion and market penetration strategies. Meanwhile, Snap-on's more modest growth trajectory highlights its focus on efficiency and niche market dominance.
These trends offer valuable insights into the strategic priorities of these industry leaders. EMCOR's focus on broadening its service offerings contrasts with Snap-on's emphasis on specialized tool manufacturing, each carving a unique niche in the industrial sector.
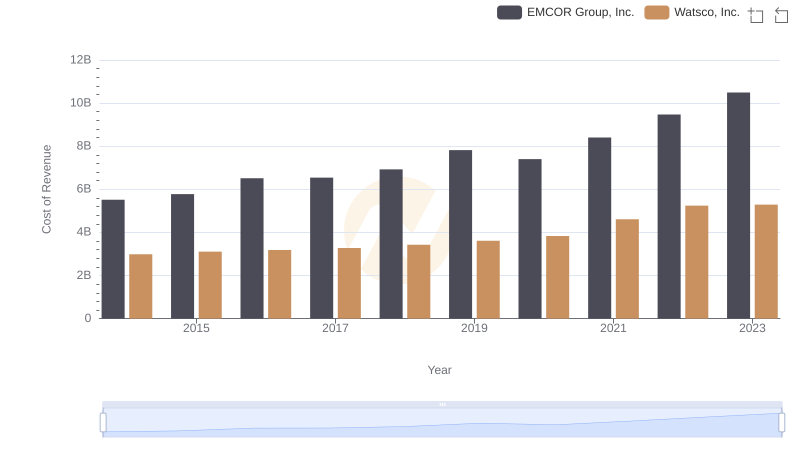
Cost Insights: Breaking Down EMCOR Group, Inc. and Watsco, Inc.'s Expenses
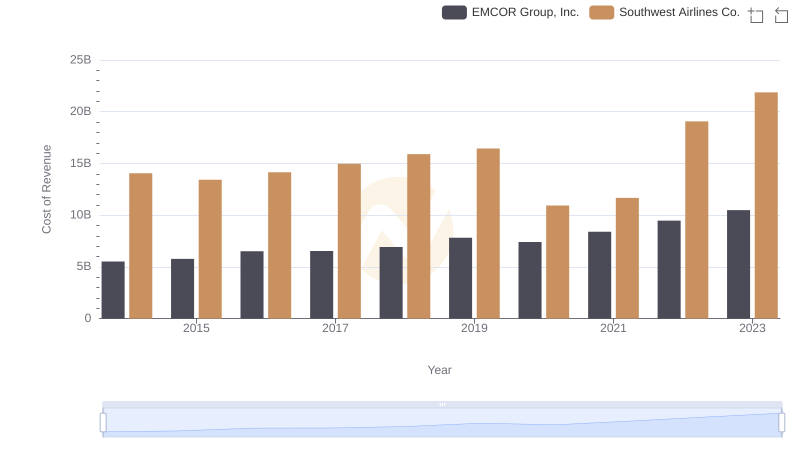
Analyzing Cost of Revenue: EMCOR Group, Inc. and Southwest Airlines Co.
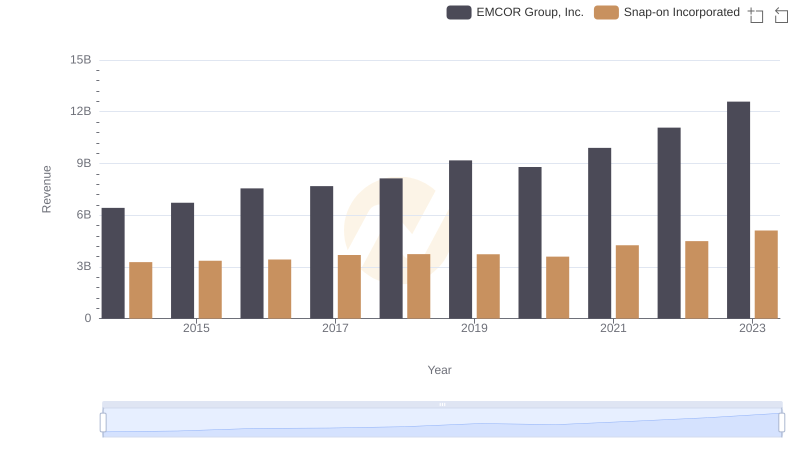
Annual Revenue Comparison: EMCOR Group, Inc. vs Snap-on Incorporated
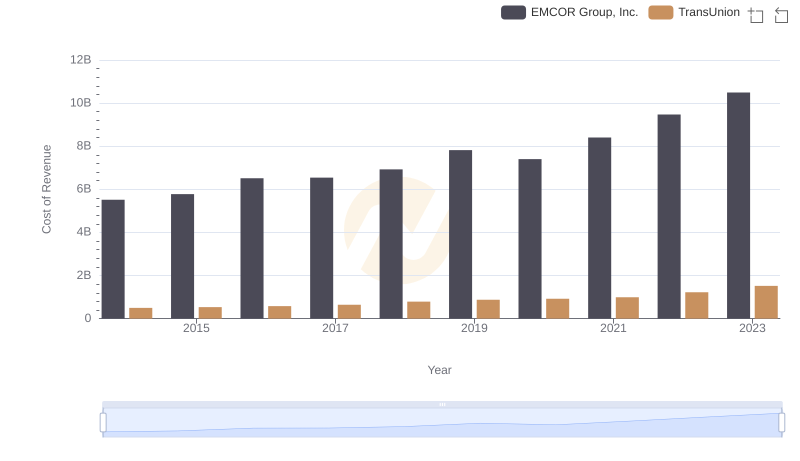
Cost of Revenue Trends: EMCOR Group, Inc. vs TransUnion
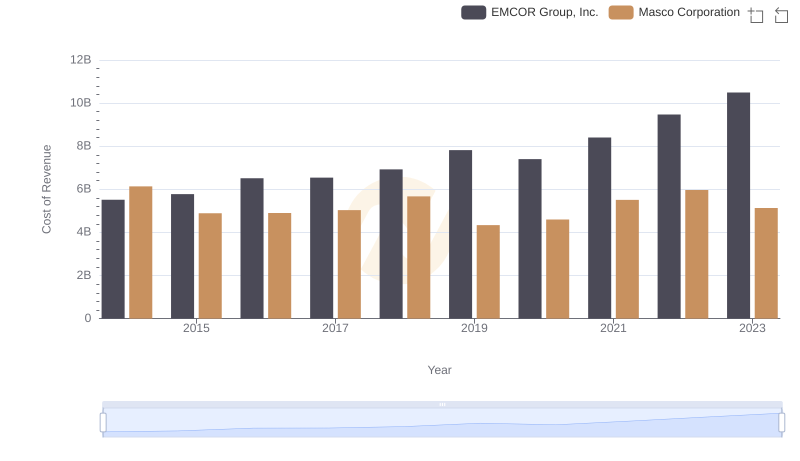
Cost of Revenue: Key Insights for EMCOR Group, Inc. and Masco Corporation
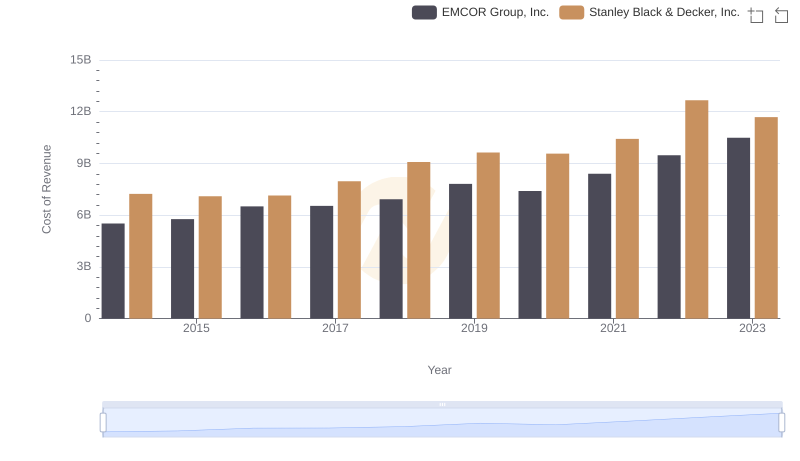
Cost of Revenue Trends: EMCOR Group, Inc. vs Stanley Black & Decker, Inc.
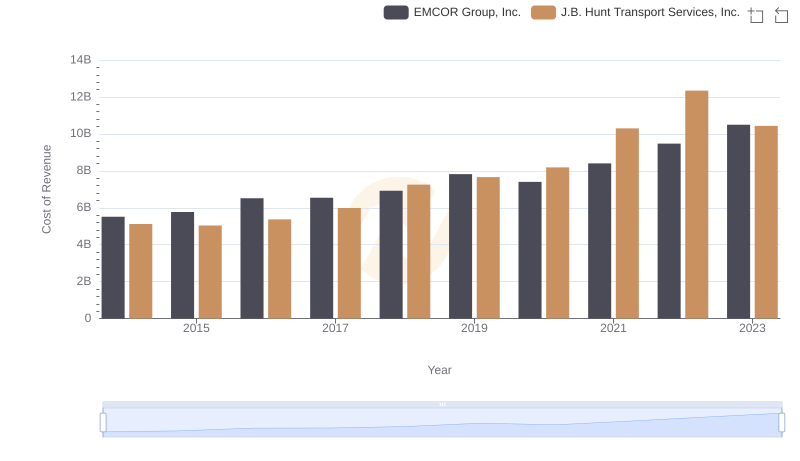
Cost of Revenue: Key Insights for EMCOR Group, Inc. and J.B. Hunt Transport Services, Inc.
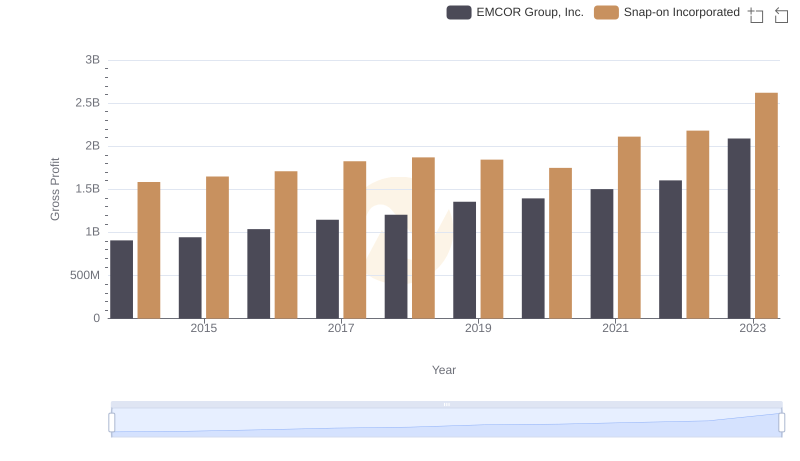
Gross Profit Comparison: EMCOR Group, Inc. and Snap-on Incorporated Trends
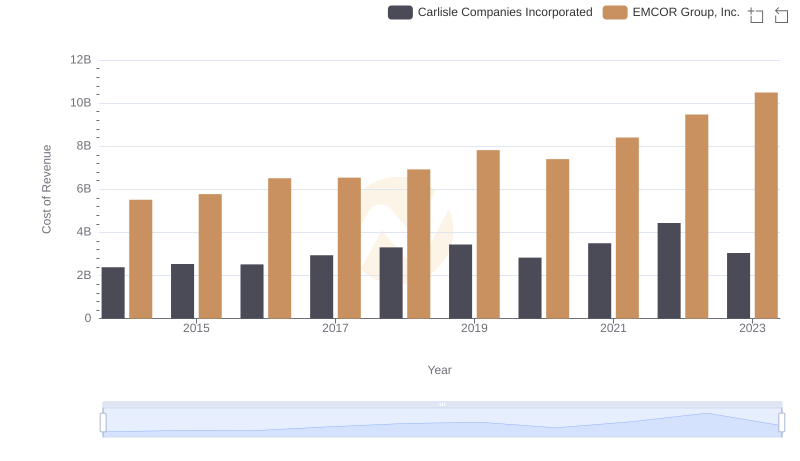
Comparing Cost of Revenue Efficiency: EMCOR Group, Inc. vs Carlisle Companies Incorporated
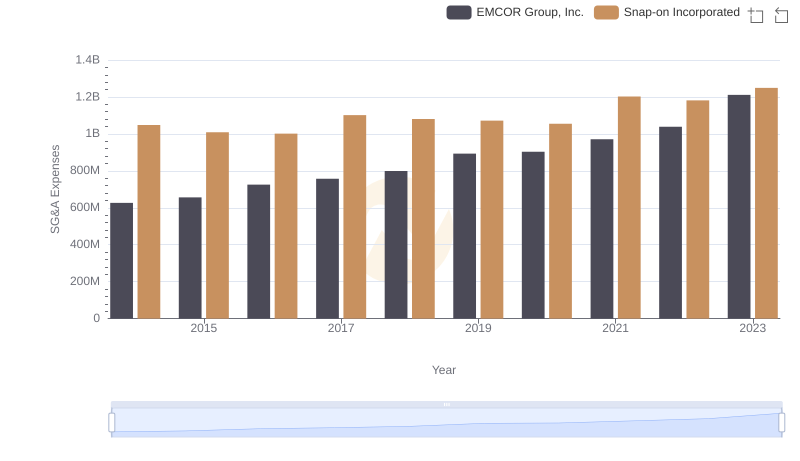
Breaking Down SG&A Expenses: EMCOR Group, Inc. vs Snap-on Incorporated
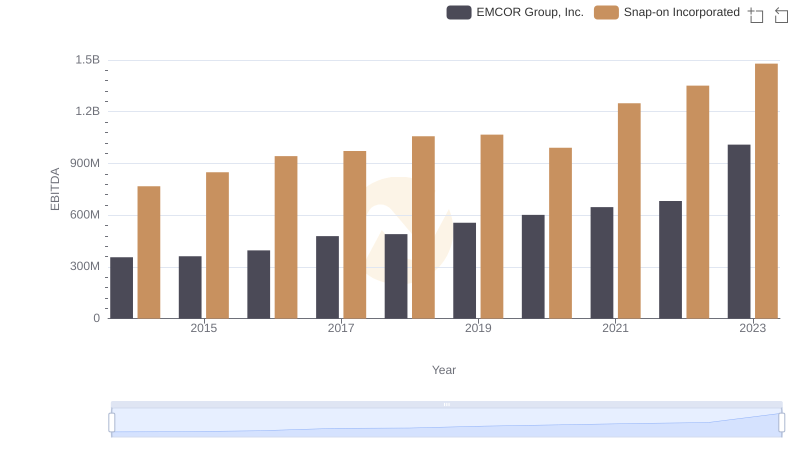
A Professional Review of EBITDA: EMCOR Group, Inc. Compared to Snap-on Incorporated