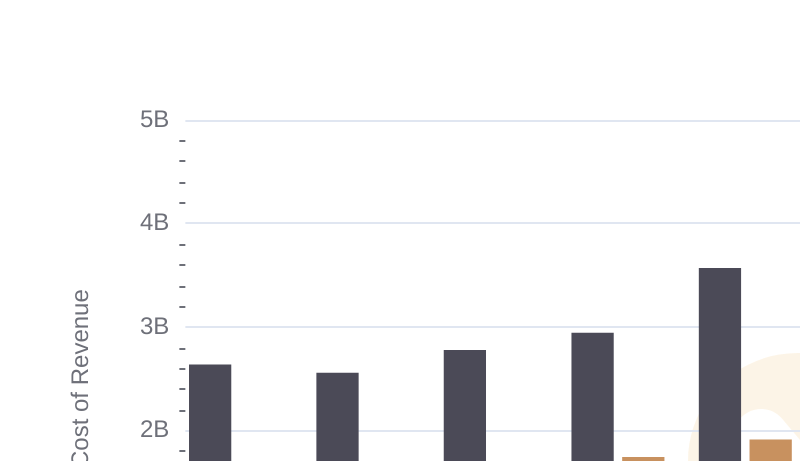
| __timestamp | Cintas Corporation | Norfolk Southern Corporation |
|---|---|---|
| Wednesday, January 1, 2014 | 2637426000 | 7109000000 |
| Thursday, January 1, 2015 | 2555549000 | 6651000000 |
| Friday, January 1, 2016 | 2775588000 | 6015000000 |
| Sunday, January 1, 2017 | 2943086000 | 6224000000 |
| Monday, January 1, 2018 | 3568109000 | 6844000000 |
| Tuesday, January 1, 2019 | 3763715000 | 6567000000 |
| Wednesday, January 1, 2020 | 3851372000 | 5749000000 |
| Friday, January 1, 2021 | 3801689000 | 6148000000 |
| Saturday, January 1, 2022 | 4222213000 | 7223000000 |
| Sunday, January 1, 2023 | 4642401000 | 6774000000 |
| Monday, January 1, 2024 | 4910199000 | 7580000000 |
Unlocking the unknown
In the ever-evolving landscape of American business, understanding the cost of revenue is crucial for evaluating a company's efficiency and profitability. This analysis delves into the cost of revenue trends for Cintas Corporation and Norfolk Southern Corporation from 2014 to 2023.
Cintas Corporation, a leader in corporate identity uniform programs, has seen a steady increase in its cost of revenue, growing by approximately 86% over the decade. This upward trend reflects the company's expansion and increased operational costs. In contrast, Norfolk Southern Corporation, a major player in the rail transportation sector, experienced fluctuations, with a notable dip in 2020, likely due to pandemic-related disruptions. However, by 2022, Norfolk Southern's cost of revenue rebounded to its highest point in the dataset.
This comparative analysis highlights the dynamic nature of cost management in different industries, offering valuable insights for investors and analysts alike.
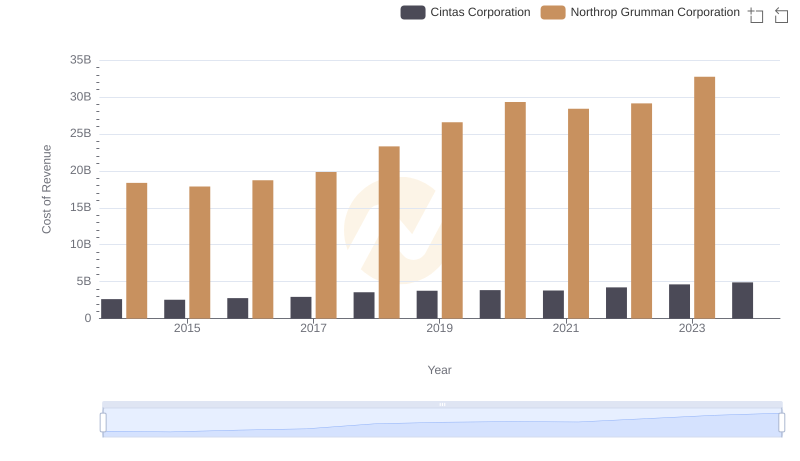
Cost of Revenue: Key Insights for Cintas Corporation and Northrop Grumman Corporation
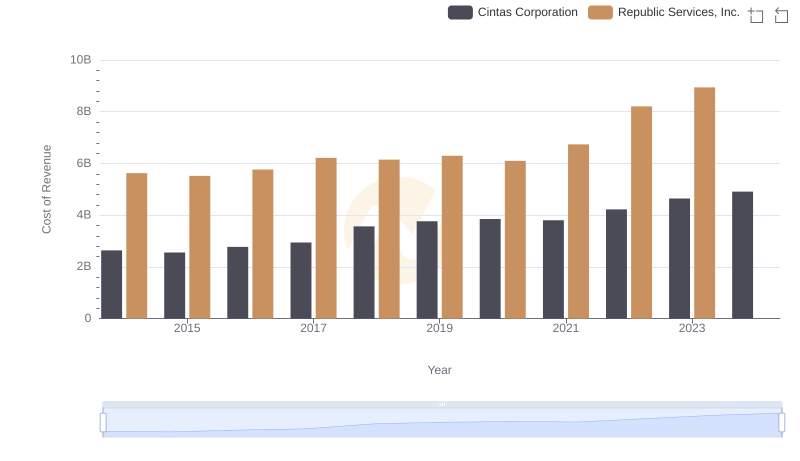
Cost Insights: Breaking Down Cintas Corporation and Republic Services, Inc.'s Expenses
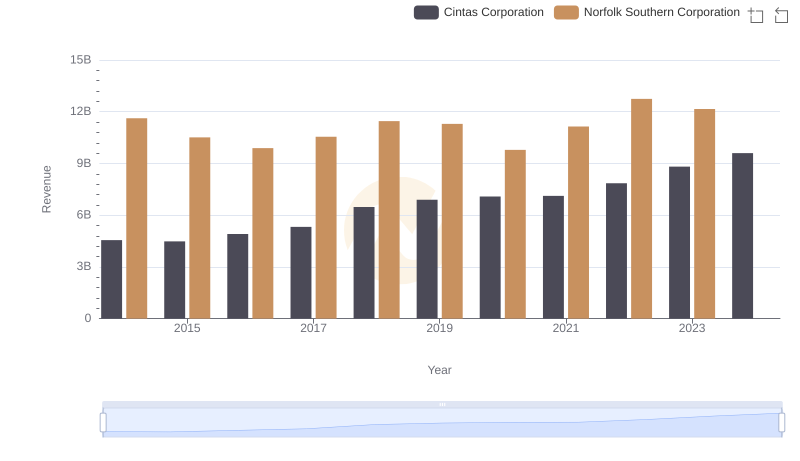
Cintas Corporation or Norfolk Southern Corporation: Who Leads in Yearly Revenue?
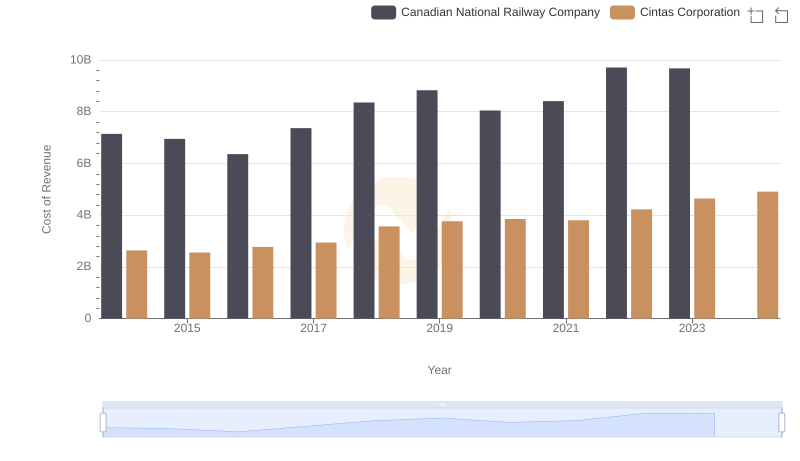
Cost Insights: Breaking Down Cintas Corporation and Canadian National Railway Company's Expenses
Cost of Revenue Comparison: Cintas Corporation vs Roper Technologies, Inc.
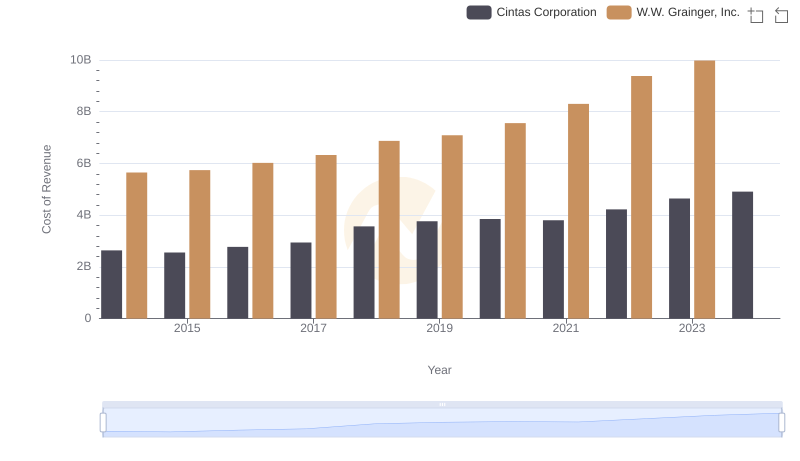
Cintas Corporation vs W.W. Grainger, Inc.: Efficiency in Cost of Revenue Explored
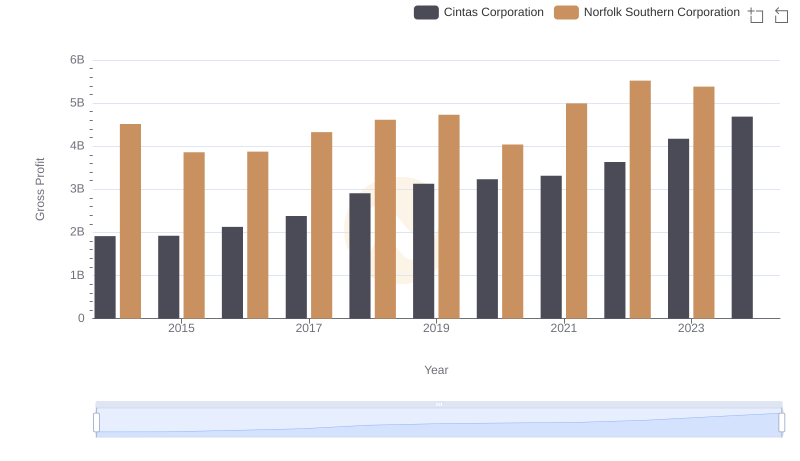
Gross Profit Analysis: Comparing Cintas Corporation and Norfolk Southern Corporation
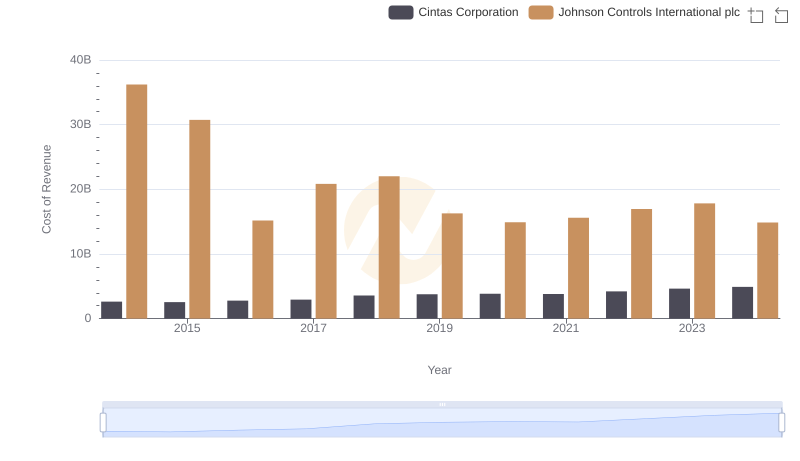
Cost of Revenue: Key Insights for Cintas Corporation and Johnson Controls International plc
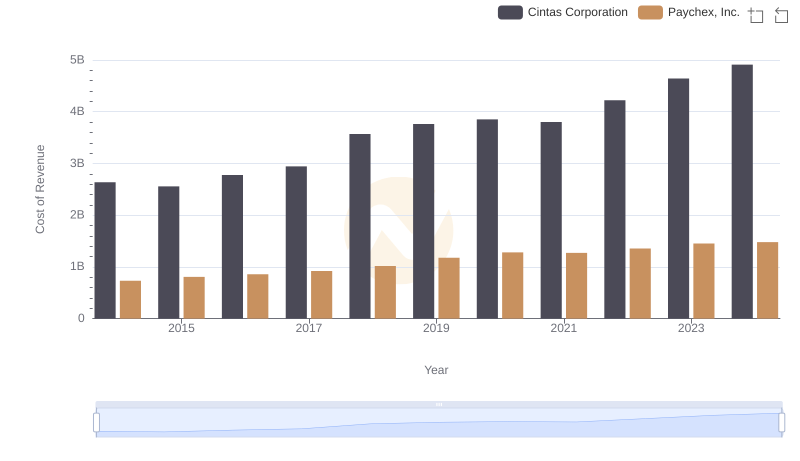
Cost Insights: Breaking Down Cintas Corporation and Paychex, Inc.'s Expenses
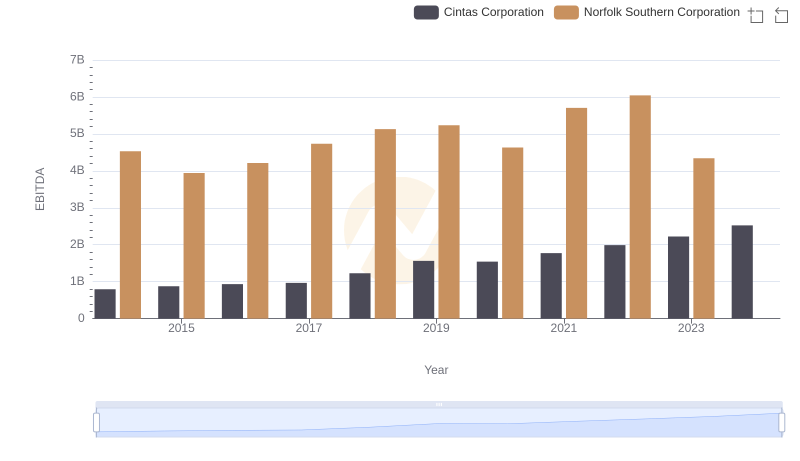
A Side-by-Side Analysis of EBITDA: Cintas Corporation and Norfolk Southern Corporation