| __timestamp | Cintas Corporation | United Rentals, Inc. |
|---|---|---|
| Wednesday, January 1, 2014 | 2637426000 | 3253000000 |
| Thursday, January 1, 2015 | 2555549000 | 3337000000 |
| Friday, January 1, 2016 | 2775588000 | 3359000000 |
| Sunday, January 1, 2017 | 2943086000 | 3872000000 |
| Monday, January 1, 2018 | 3568109000 | 4683000000 |
| Tuesday, January 1, 2019 | 3763715000 | 5681000000 |
| Wednesday, January 1, 2020 | 3851372000 | 5347000000 |
| Friday, January 1, 2021 | 3801689000 | 5863000000 |
| Saturday, January 1, 2022 | 4222213000 | 6646000000 |
| Sunday, January 1, 2023 | 4642401000 | 8519000000 |
| Monday, January 1, 2024 | 4910199000 | 9195000000 |
Data in motion
In the competitive landscape of American business, cost efficiency is a critical metric for success. Over the past decade, Cintas Corporation and United Rentals, Inc. have demonstrated contrasting trajectories in their cost of revenue. From 2014 to 2024, Cintas Corporation's cost of revenue increased by approximately 86%, reflecting a steady growth in operational expenses. In contrast, United Rentals, Inc. saw a staggering 183% rise, indicating a more aggressive expansion strategy.
By 2023, United Rentals' cost of revenue was nearly double that of Cintas, highlighting its larger scale of operations. However, this also raises questions about efficiency and profitability. As businesses navigate the post-pandemic economy, understanding these trends offers valuable insights into strategic planning and resource allocation. This analysis underscores the importance of balancing growth with cost management to sustain long-term success.
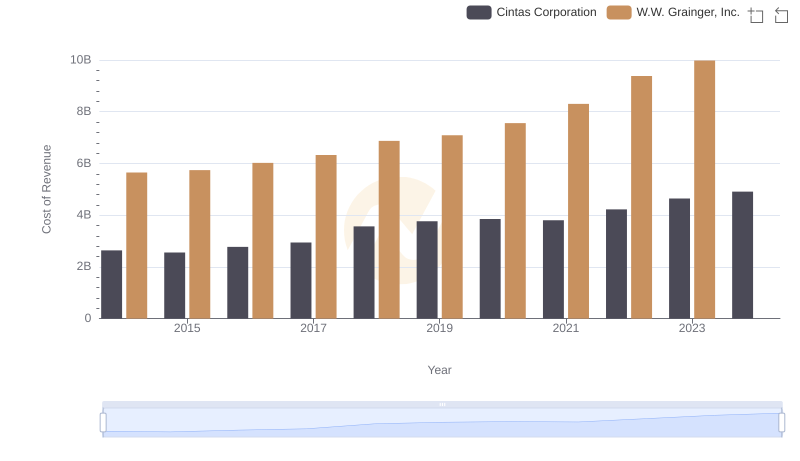
Cintas Corporation vs W.W. Grainger, Inc.: Efficiency in Cost of Revenue Explored
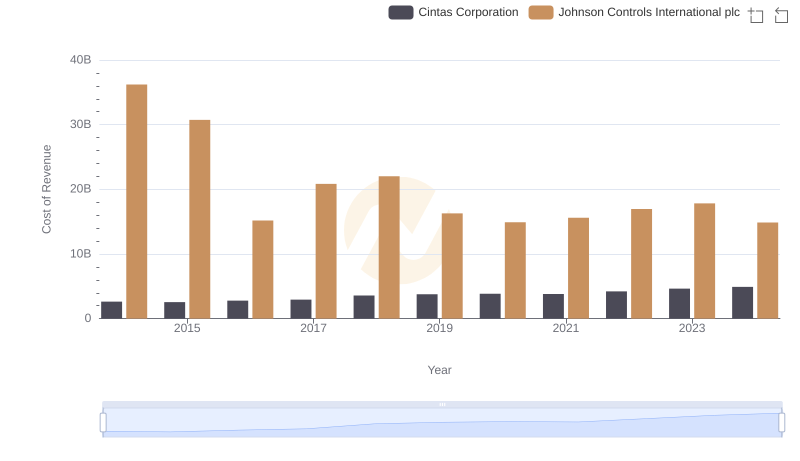
Cost of Revenue: Key Insights for Cintas Corporation and Johnson Controls International plc
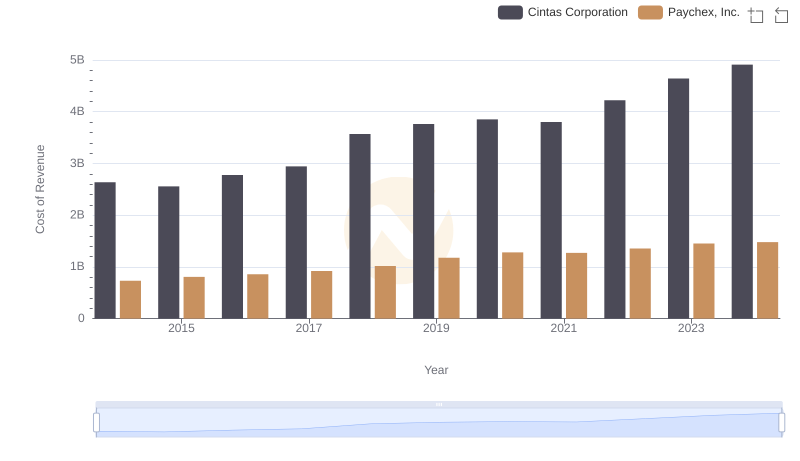
Cost Insights: Breaking Down Cintas Corporation and Paychex, Inc.'s Expenses
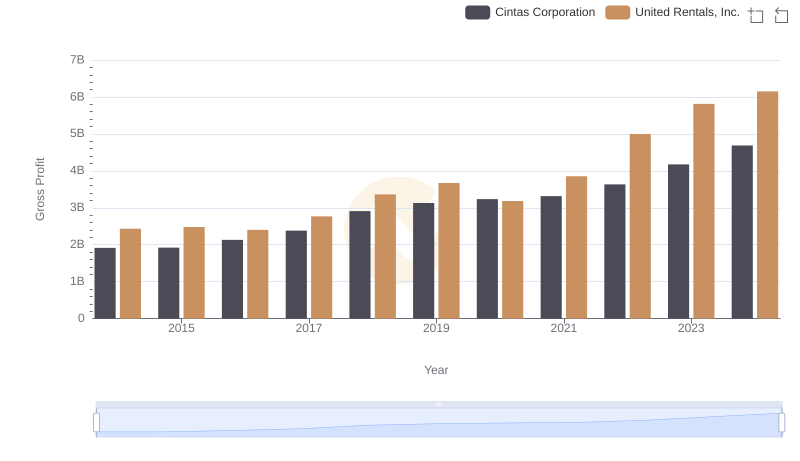
Gross Profit Analysis: Comparing Cintas Corporation and United Rentals, Inc.
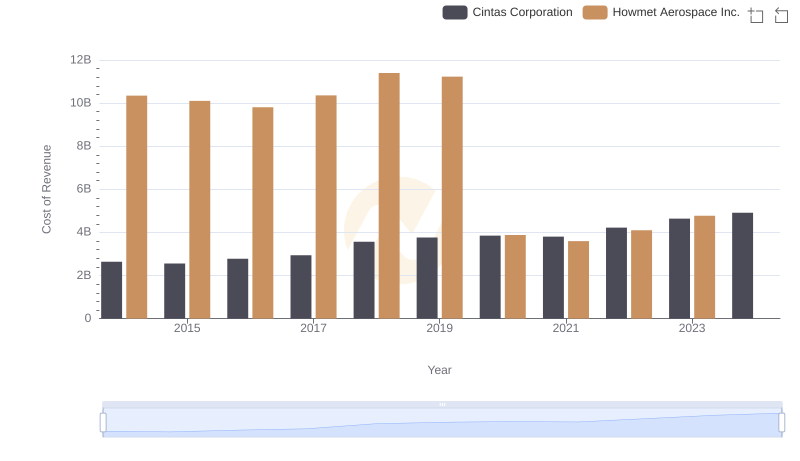
Cost of Revenue Comparison: Cintas Corporation vs Howmet Aerospace Inc.
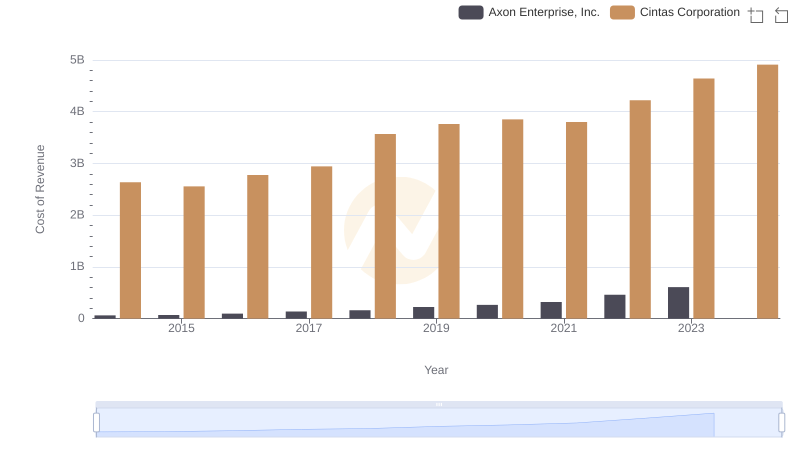
Cost of Revenue: Key Insights for Cintas Corporation and Axon Enterprise, Inc.
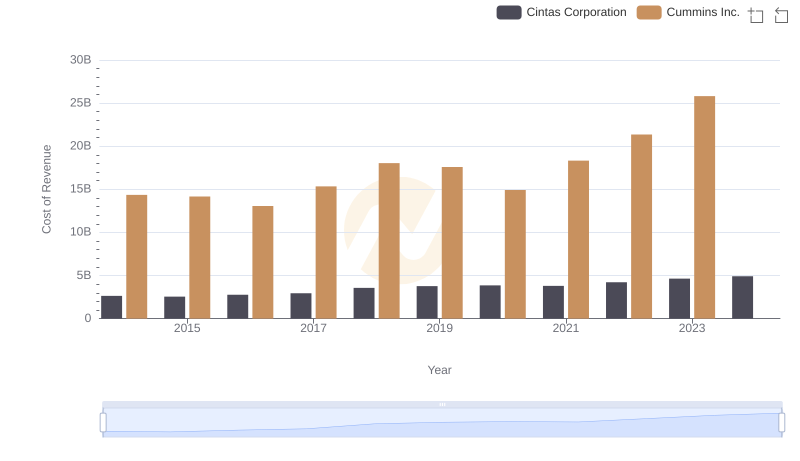
Cost Insights: Breaking Down Cintas Corporation and Cummins Inc.'s Expenses
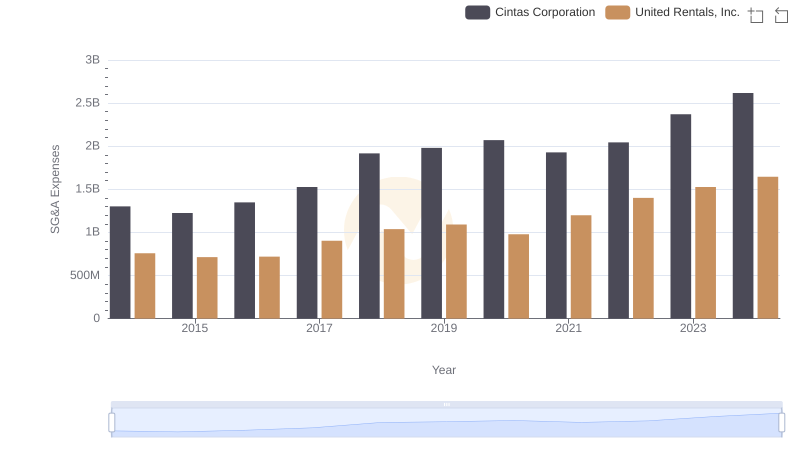
Cost Management Insights: SG&A Expenses for Cintas Corporation and United Rentals, Inc.
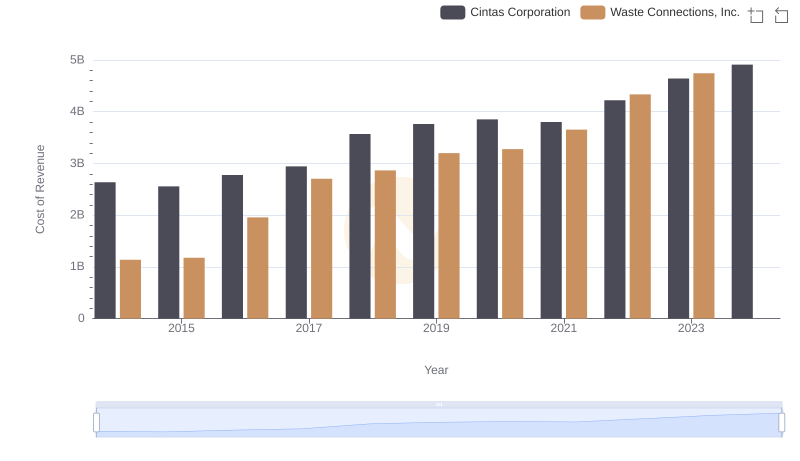
Cost of Revenue Comparison: Cintas Corporation vs Waste Connections, Inc.
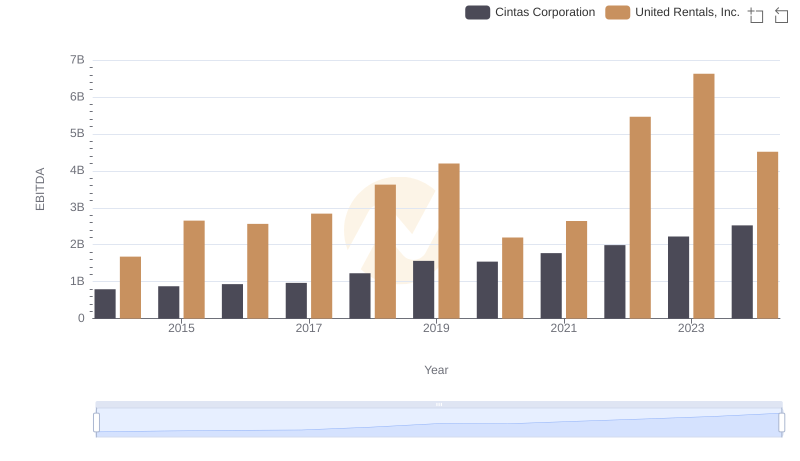
Comprehensive EBITDA Comparison: Cintas Corporation vs United Rentals, Inc.