| __timestamp | Cintas Corporation | W.W. Grainger, Inc. |
|---|---|---|
| Wednesday, January 1, 2014 | 2637426000 | 5650711000 |
| Thursday, January 1, 2015 | 2555549000 | 5741956000 |
| Friday, January 1, 2016 | 2775588000 | 6022647000 |
| Sunday, January 1, 2017 | 2943086000 | 6327301000 |
| Monday, January 1, 2018 | 3568109000 | 6873000000 |
| Tuesday, January 1, 2019 | 3763715000 | 7089000000 |
| Wednesday, January 1, 2020 | 3851372000 | 7559000000 |
| Friday, January 1, 2021 | 3801689000 | 8302000000 |
| Saturday, January 1, 2022 | 4222213000 | 9379000000 |
| Sunday, January 1, 2023 | 4642401000 | 9982000000 |
| Monday, January 1, 2024 | 4910199000 | 10410000000 |
Unveiling the hidden dimensions of data
In the competitive landscape of industrial supply, cost efficiency is paramount. Cintas Corporation and W.W. Grainger, Inc. have been industry leaders, but how do they compare in terms of cost of revenue? From 2014 to 2023, Cintas Corporation's cost of revenue increased by approximately 86%, while W.W. Grainger, Inc. saw a 77% rise. This trend highlights Cintas's aggressive growth strategy, with a notable surge in 2023, reaching nearly $4.9 billion. Meanwhile, Grainger's cost of revenue peaked at nearly $10 billion in 2023, reflecting its expansive operations. However, data for 2024 is missing for Grainger, leaving room for speculation on its future trajectory. This analysis underscores the importance of cost management in sustaining competitive advantage in the industrial supply sector.
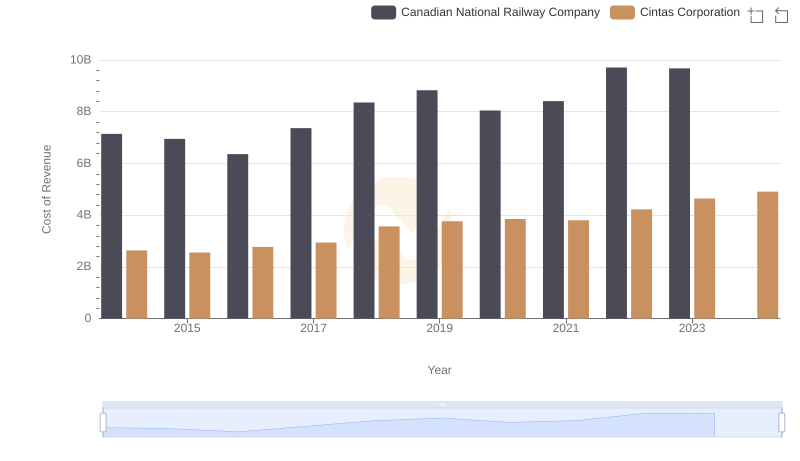
Cost Insights: Breaking Down Cintas Corporation and Canadian National Railway Company's Expenses
Cost of Revenue Comparison: Cintas Corporation vs Roper Technologies, Inc.
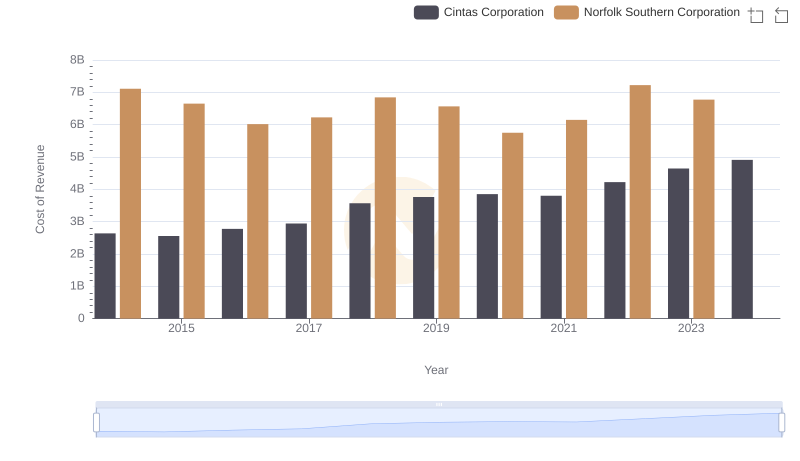
Cost of Revenue: Key Insights for Cintas Corporation and Norfolk Southern Corporation
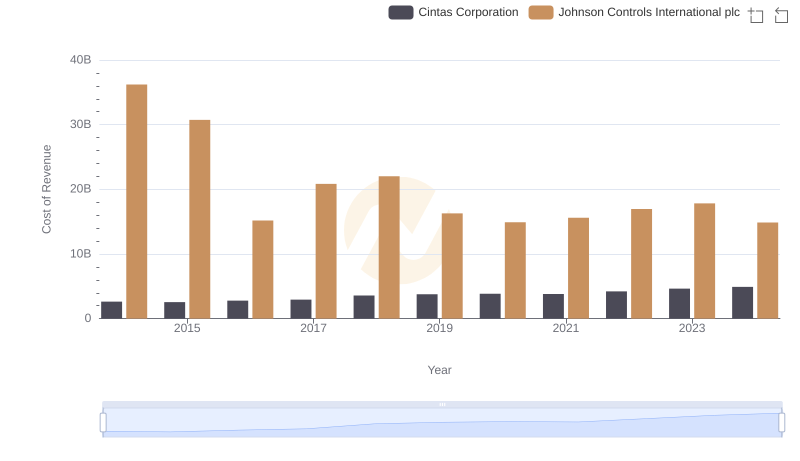
Cost of Revenue: Key Insights for Cintas Corporation and Johnson Controls International plc
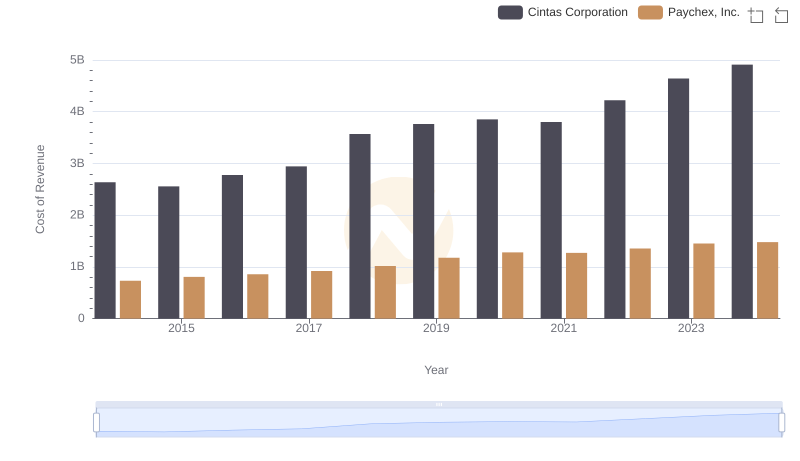
Cost Insights: Breaking Down Cintas Corporation and Paychex, Inc.'s Expenses
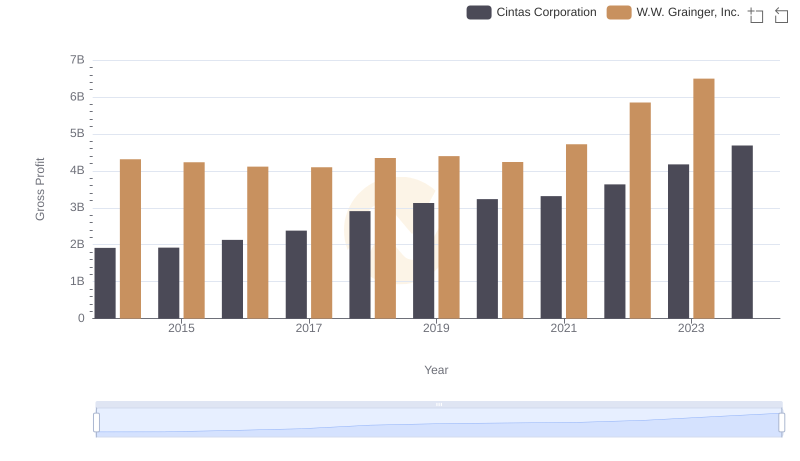
Who Generates Higher Gross Profit? Cintas Corporation or W.W. Grainger, Inc.
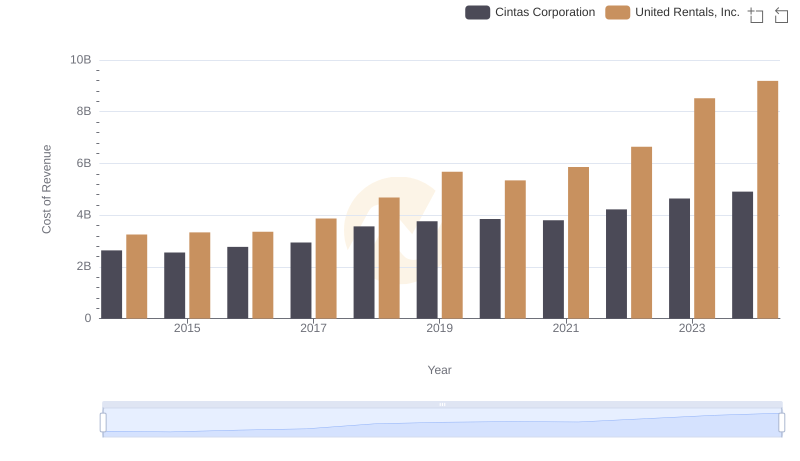
Comparing Cost of Revenue Efficiency: Cintas Corporation vs United Rentals, Inc.
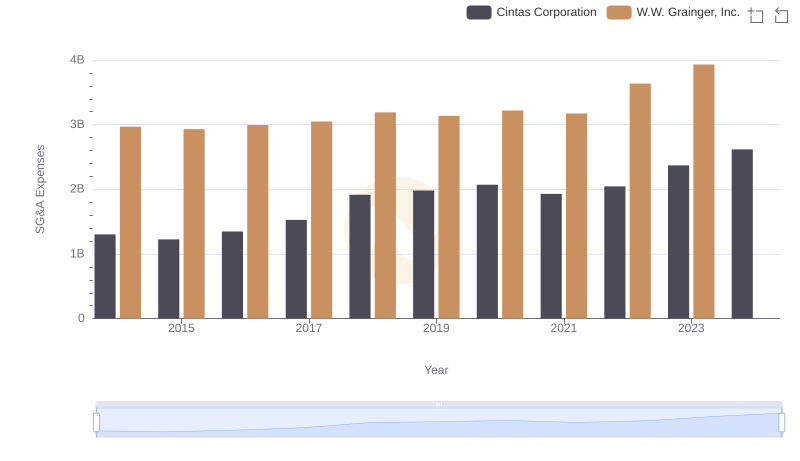
Cintas Corporation vs W.W. Grainger, Inc.: SG&A Expense Trends
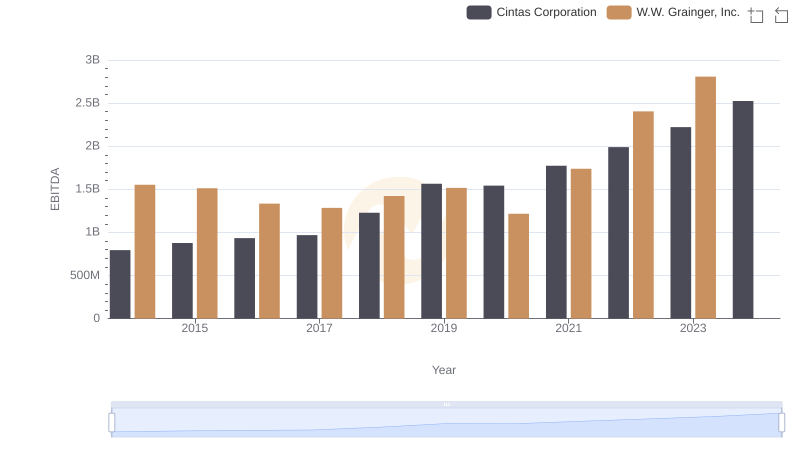
Cintas Corporation vs W.W. Grainger, Inc.: In-Depth EBITDA Performance Comparison