| __timestamp | Cintas Corporation | Roper Technologies, Inc. |
|---|---|---|
| Wednesday, January 1, 2014 | 2637426000 | 1447595000 |
| Thursday, January 1, 2015 | 2555549000 | 1417749000 |
| Friday, January 1, 2016 | 2775588000 | 1457515000 |
| Sunday, January 1, 2017 | 2943086000 | 1742675000 |
| Monday, January 1, 2018 | 3568109000 | 1911700000 |
| Tuesday, January 1, 2019 | 3763715000 | 1939700000 |
| Wednesday, January 1, 2020 | 3851372000 | 1984100000 |
| Friday, January 1, 2021 | 3801689000 | 1860400000 |
| Saturday, January 1, 2022 | 4222213000 | 1619000000 |
| Sunday, January 1, 2023 | 4642401000 | 1870600000 |
| Monday, January 1, 2024 | 4910199000 | 2160900000 |
Cracking the code
In the competitive landscape of industrial services and technology, Cintas Corporation and Roper Technologies, Inc. have been pivotal players. Over the past decade, Cintas has consistently outpaced Roper in terms of cost of revenue, reflecting its expansive operational scale. From 2014 to 2023, Cintas saw a remarkable 86% increase in its cost of revenue, peaking at approximately $4.64 billion in 2023. In contrast, Roper's cost of revenue grew by about 29% over the same period, reaching nearly $1.87 billion in 2023.
The data for 2024 is incomplete, suggesting ongoing developments in these companies' financial strategies.
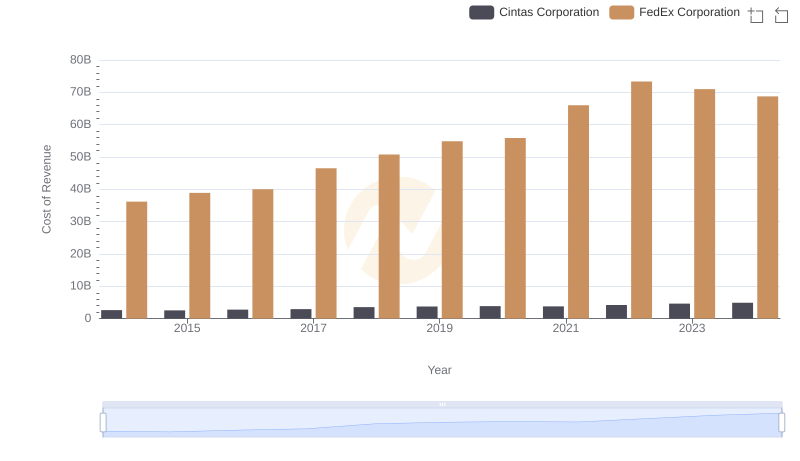
Cintas Corporation vs FedEx Corporation: Efficiency in Cost of Revenue Explored
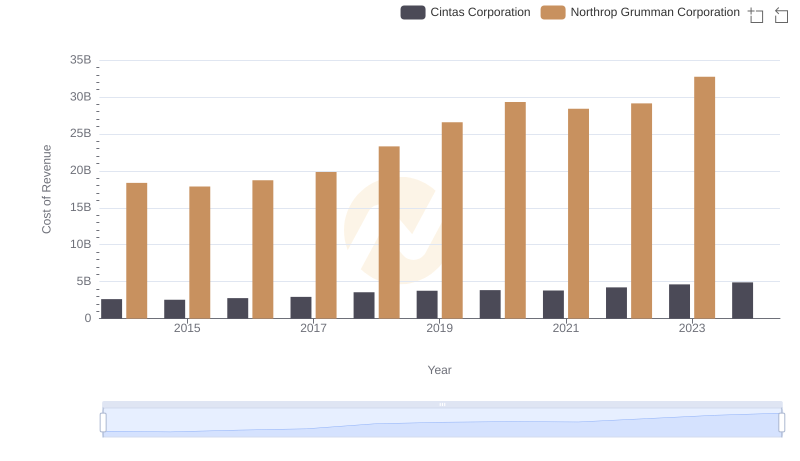
Cost of Revenue: Key Insights for Cintas Corporation and Northrop Grumman Corporation
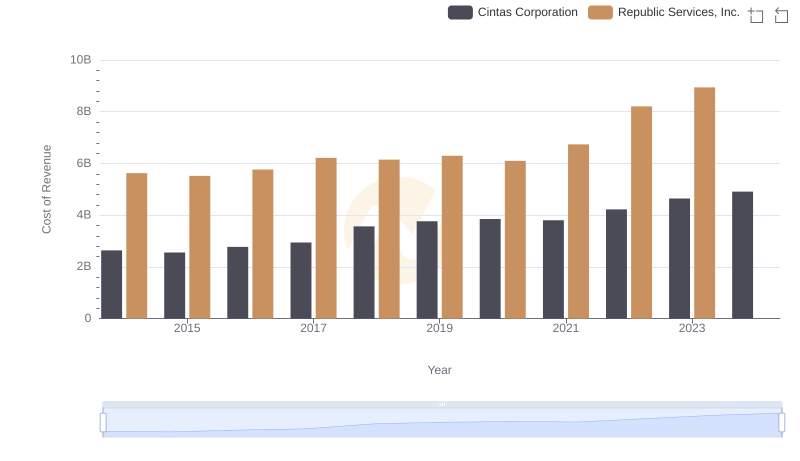
Cost Insights: Breaking Down Cintas Corporation and Republic Services, Inc.'s Expenses
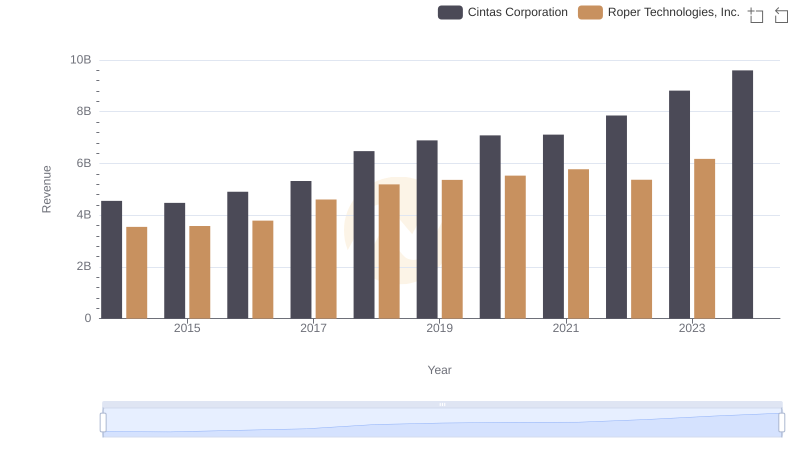
Comparing Revenue Performance: Cintas Corporation or Roper Technologies, Inc.?
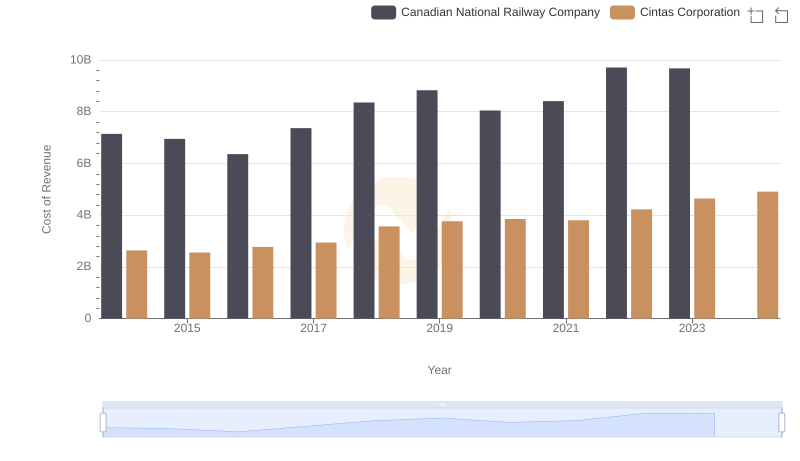
Cost Insights: Breaking Down Cintas Corporation and Canadian National Railway Company's Expenses
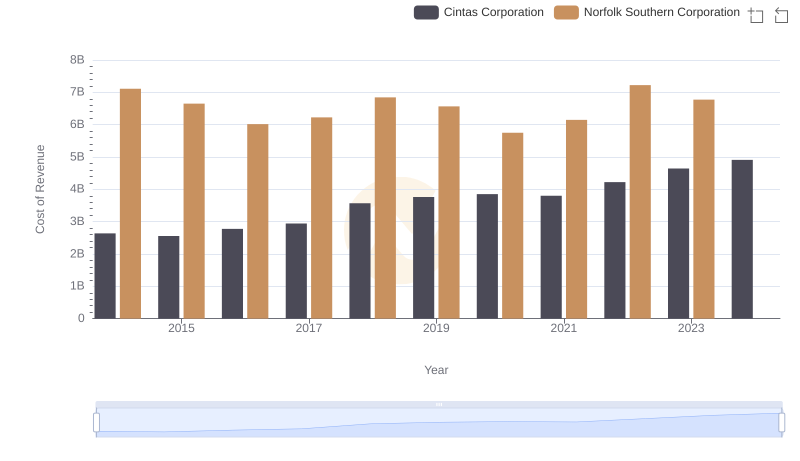
Cost of Revenue: Key Insights for Cintas Corporation and Norfolk Southern Corporation
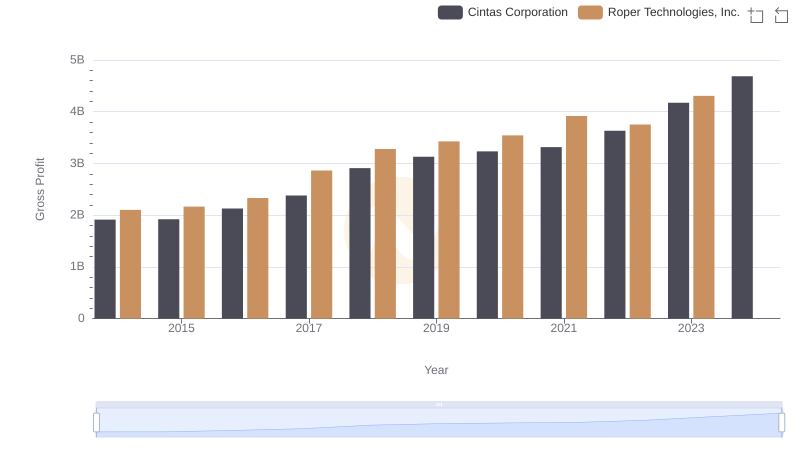
Key Insights on Gross Profit: Cintas Corporation vs Roper Technologies, Inc.
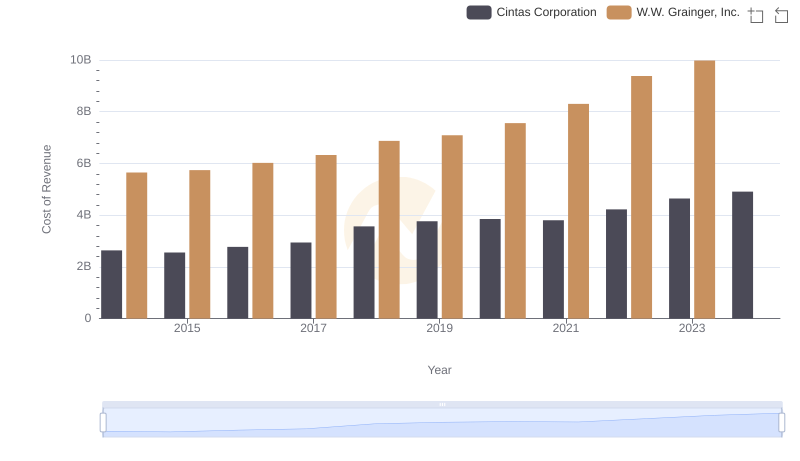
Cintas Corporation vs W.W. Grainger, Inc.: Efficiency in Cost of Revenue Explored
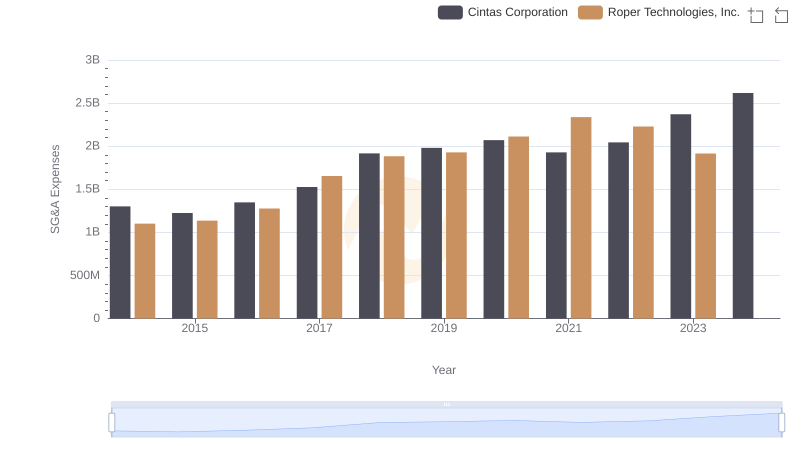
Comparing SG&A Expenses: Cintas Corporation vs Roper Technologies, Inc. Trends and Insights
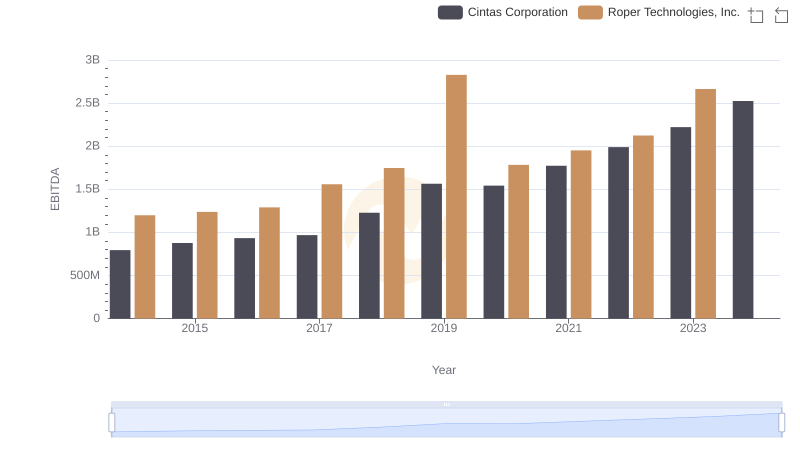
Comprehensive EBITDA Comparison: Cintas Corporation vs Roper Technologies, Inc.