| __timestamp | United Rentals, Inc. | Xylem Inc. |
|---|---|---|
| Wednesday, January 1, 2014 | 2432000000 | 1513000000 |
| Thursday, January 1, 2015 | 2480000000 | 1404000000 |
| Friday, January 1, 2016 | 2403000000 | 1461000000 |
| Sunday, January 1, 2017 | 2769000000 | 1851000000 |
| Monday, January 1, 2018 | 3364000000 | 2026000000 |
| Tuesday, January 1, 2019 | 3670000000 | 2046000000 |
| Wednesday, January 1, 2020 | 3183000000 | 1830000000 |
| Friday, January 1, 2021 | 3853000000 | 1975000000 |
| Saturday, January 1, 2022 | 4996000000 | 2084000000 |
| Sunday, January 1, 2023 | 5813000000 | 2717000000 |
| Monday, January 1, 2024 | 6150000000 |
Cracking the code
In the ever-evolving landscape of industrial equipment and water technology, United Rentals, Inc. and Xylem Inc. have showcased remarkable growth over the past decade. Since 2014, United Rentals has seen its gross profit soar by approximately 153%, reaching a peak in 2024. This impressive growth trajectory highlights the company's strategic expansions and market adaptability. Meanwhile, Xylem Inc. has also demonstrated a steady upward trend, with a 79% increase in gross profit from 2014 to 2023. This growth underscores Xylem's commitment to innovation in water solutions. Notably, the data for 2024 is incomplete for Xylem, leaving room for speculation on its future performance. As these industry giants continue to evolve, their financial trajectories offer valuable insights into the broader economic trends and technological advancements shaping their respective sectors.
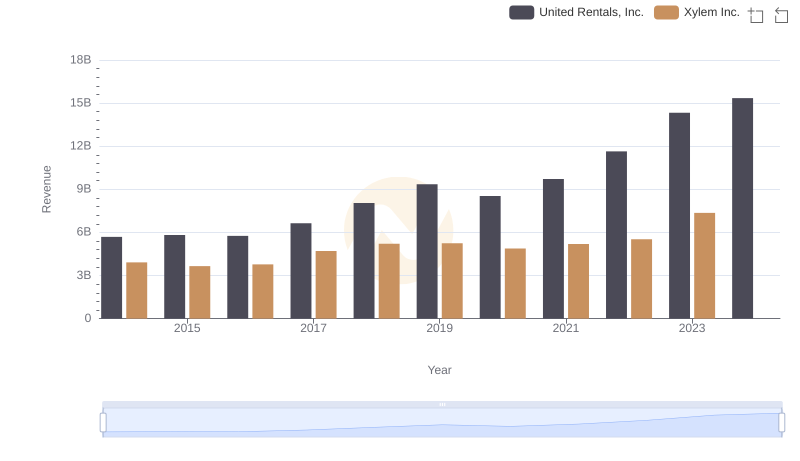
United Rentals, Inc. vs Xylem Inc.: Examining Key Revenue Metrics
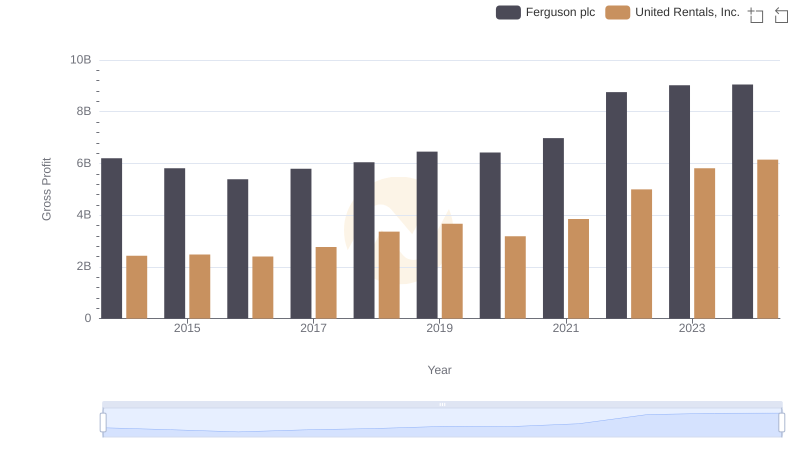
Key Insights on Gross Profit: United Rentals, Inc. vs Ferguson plc
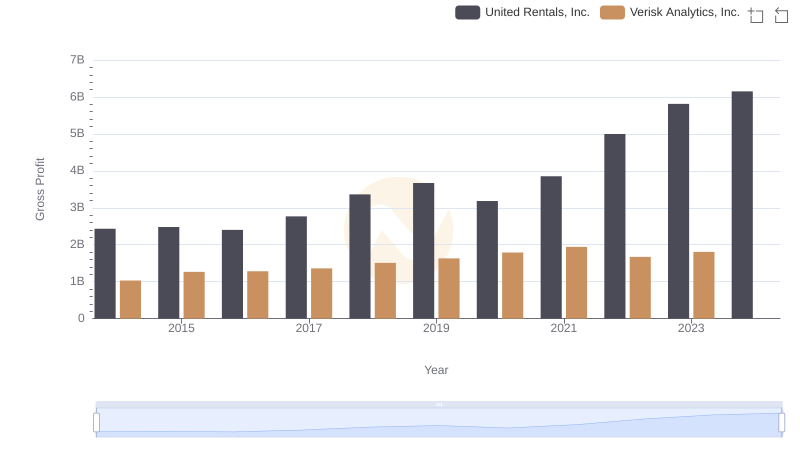
Gross Profit Trends Compared: United Rentals, Inc. vs Verisk Analytics, Inc.
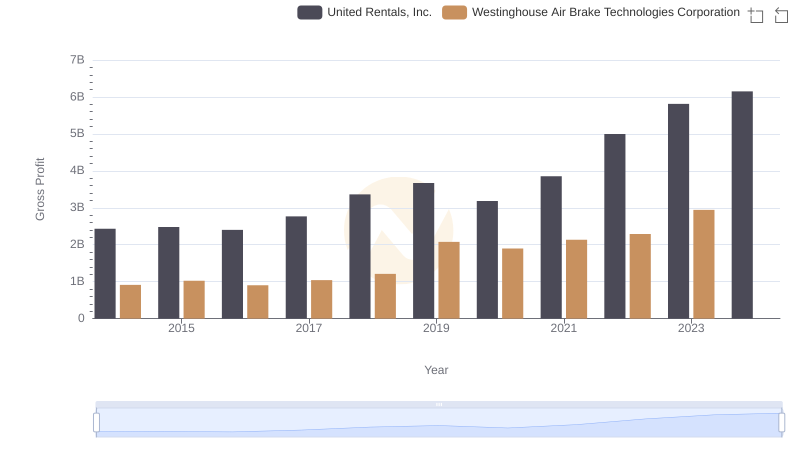
United Rentals, Inc. and Westinghouse Air Brake Technologies Corporation: A Detailed Gross Profit Analysis
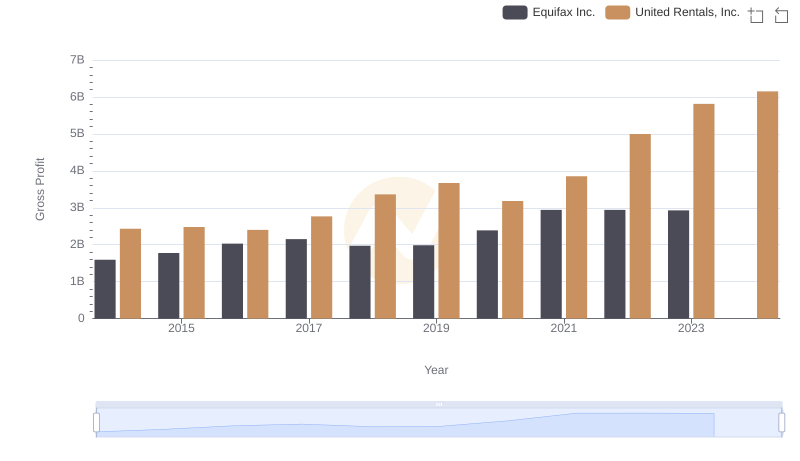
Gross Profit Comparison: United Rentals, Inc. and Equifax Inc. Trends
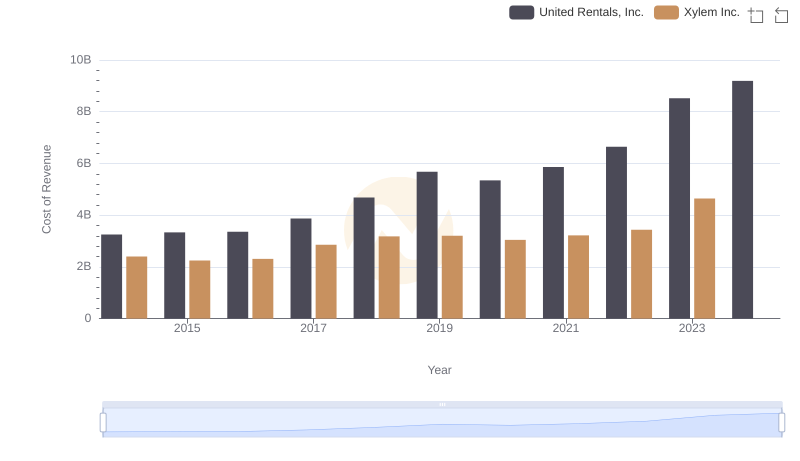
Cost of Revenue Comparison: United Rentals, Inc. vs Xylem Inc.
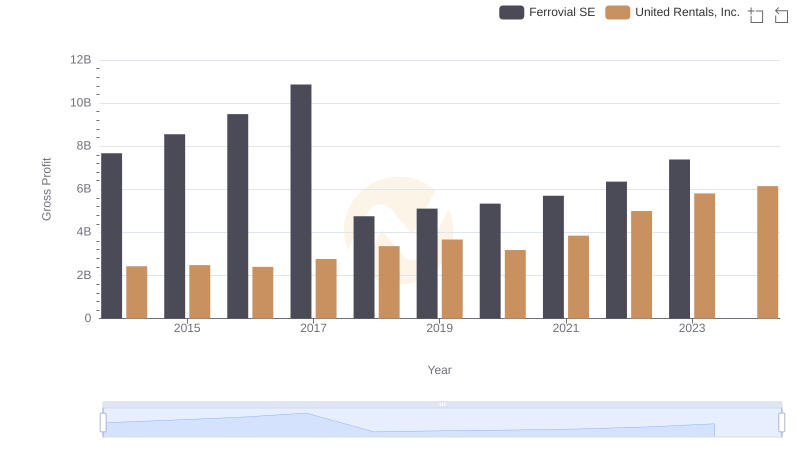
Who Generates Higher Gross Profit? United Rentals, Inc. or Ferrovial SE
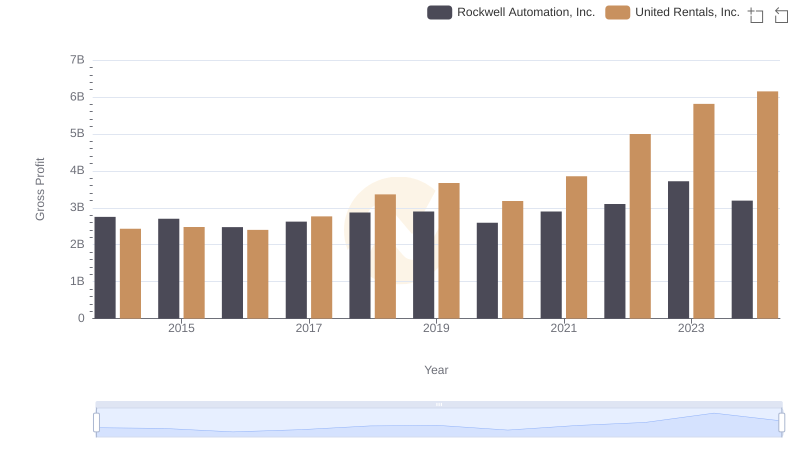
Who Generates Higher Gross Profit? United Rentals, Inc. or Rockwell Automation, Inc.
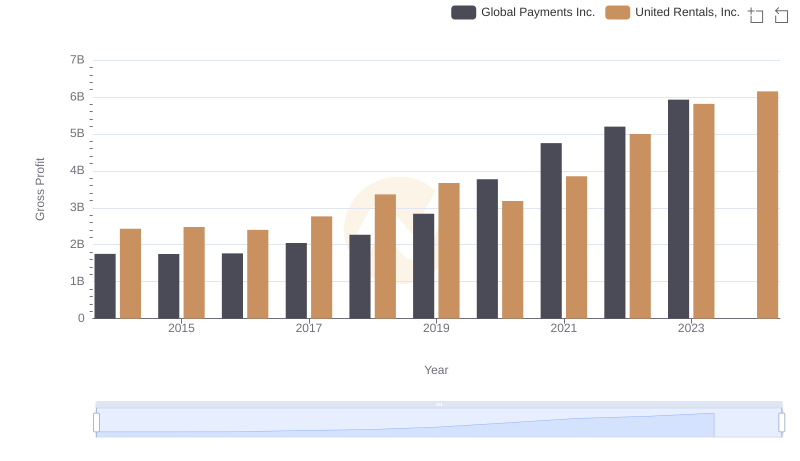
United Rentals, Inc. vs Global Payments Inc.: A Gross Profit Performance Breakdown
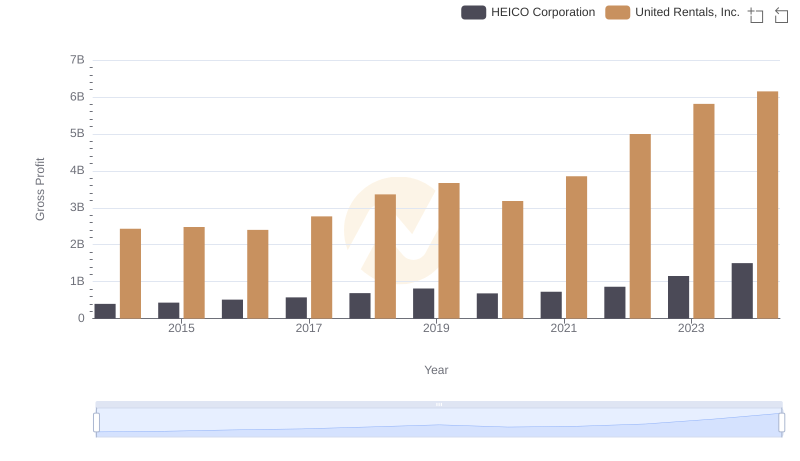
Who Generates Higher Gross Profit? United Rentals, Inc. or HEICO Corporation
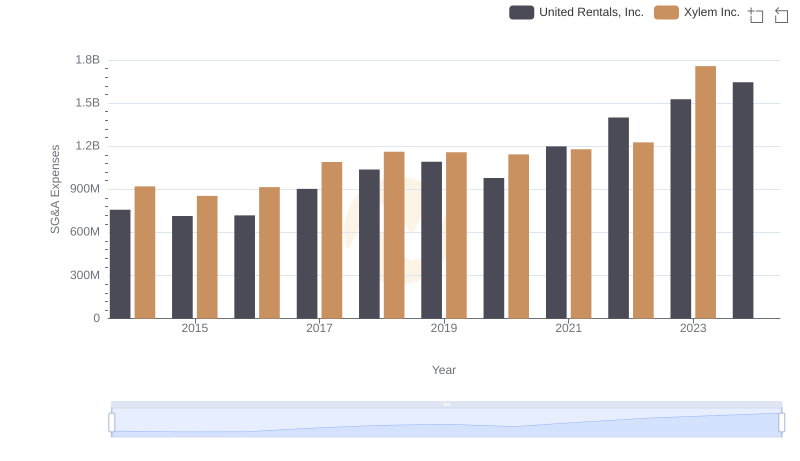
United Rentals, Inc. and Xylem Inc.: SG&A Spending Patterns Compared
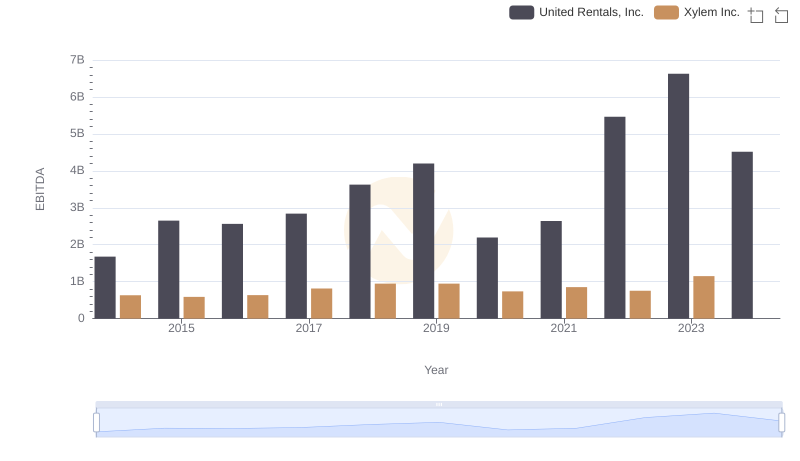
A Side-by-Side Analysis of EBITDA: United Rentals, Inc. and Xylem Inc.