| __timestamp | United Rentals, Inc. | Xylem Inc. |
|---|---|---|
| Wednesday, January 1, 2014 | 5685000000 | 3916000000 |
| Thursday, January 1, 2015 | 5817000000 | 3653000000 |
| Friday, January 1, 2016 | 5762000000 | 3771000000 |
| Sunday, January 1, 2017 | 6641000000 | 4707000000 |
| Monday, January 1, 2018 | 8047000000 | 5207000000 |
| Tuesday, January 1, 2019 | 9351000000 | 5249000000 |
| Wednesday, January 1, 2020 | 8530000000 | 4876000000 |
| Friday, January 1, 2021 | 9716000000 | 5195000000 |
| Saturday, January 1, 2022 | 11642000000 | 5522000000 |
| Sunday, January 1, 2023 | 14332000000 | 7364000000 |
| Monday, January 1, 2024 | 15345000000 |
Unveiling the hidden dimensions of data
In the ever-evolving landscape of industrial services and water technology, United Rentals, Inc. and Xylem Inc. have emerged as formidable players. Over the past decade, United Rentals has seen its revenue soar by approximately 170%, from $5.7 billion in 2014 to an impressive $15.3 billion in 2024. This growth underscores its strategic acquisitions and robust market demand.
Conversely, Xylem Inc., a leader in water solutions, has experienced a steady revenue increase of nearly 88% over the same period, reaching $7.4 billion in 2023. This growth reflects the rising global emphasis on sustainable water management.
While United Rentals continues its upward trajectory, Xylem's data for 2024 remains elusive, leaving industry watchers eager for updates. As these companies navigate the future, their performance will be pivotal in shaping their respective industries.
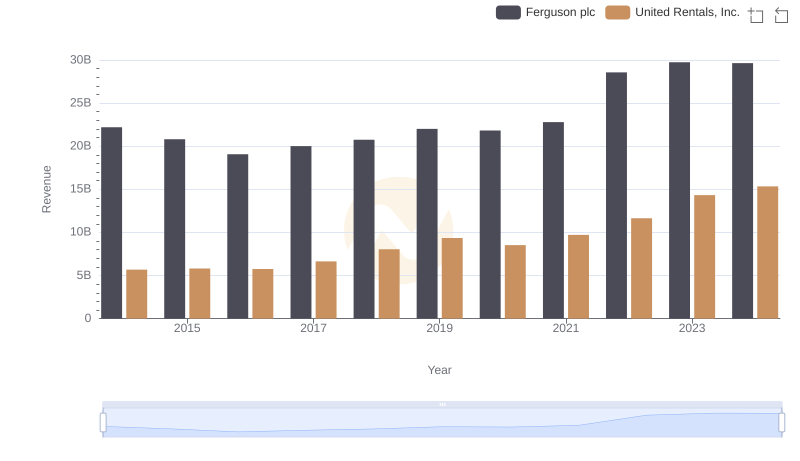
United Rentals, Inc. or Ferguson plc: Who Leads in Yearly Revenue?
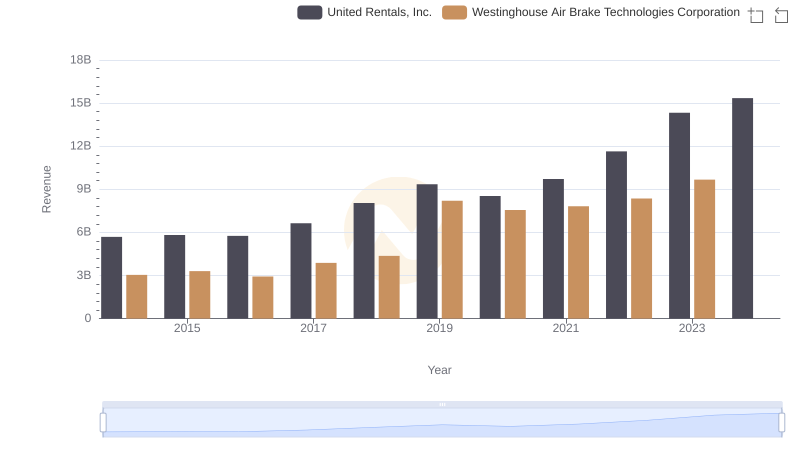
United Rentals, Inc. and Westinghouse Air Brake Technologies Corporation: A Comprehensive Revenue Analysis
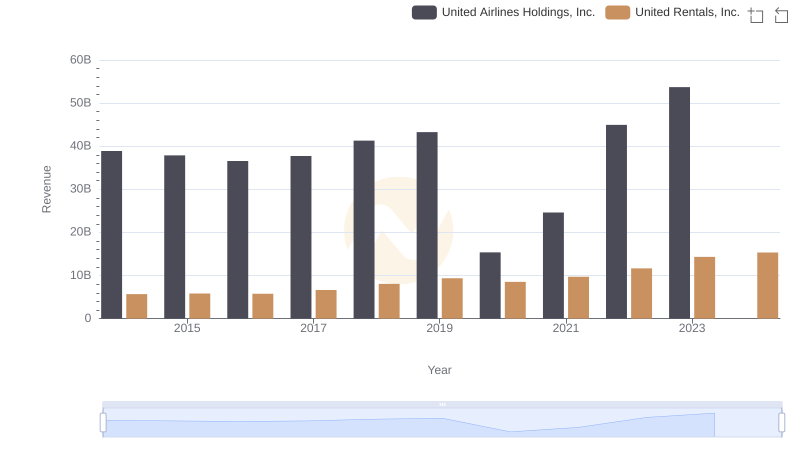
United Rentals, Inc. vs United Airlines Holdings, Inc.: Examining Key Revenue Metrics
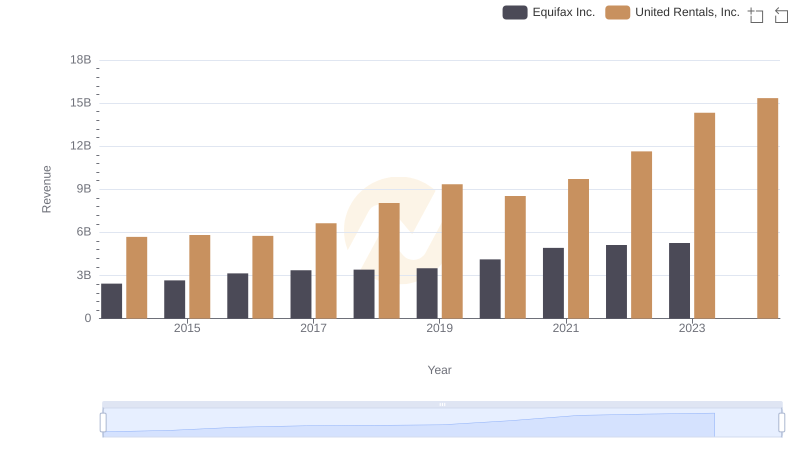
United Rentals, Inc. vs Equifax Inc.: Annual Revenue Growth Compared
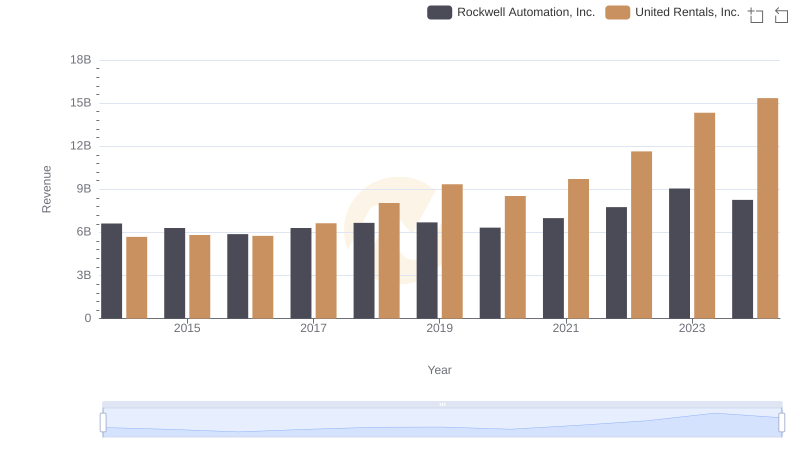
Annual Revenue Comparison: United Rentals, Inc. vs Rockwell Automation, Inc.
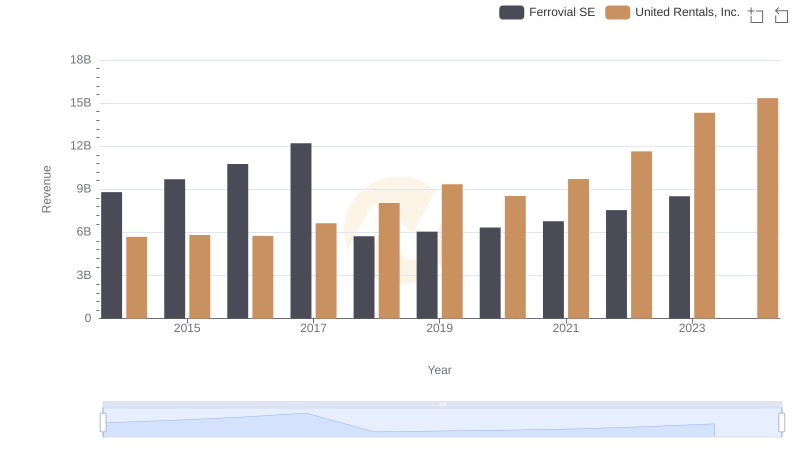
United Rentals, Inc. or Ferrovial SE: Who Leads in Yearly Revenue?
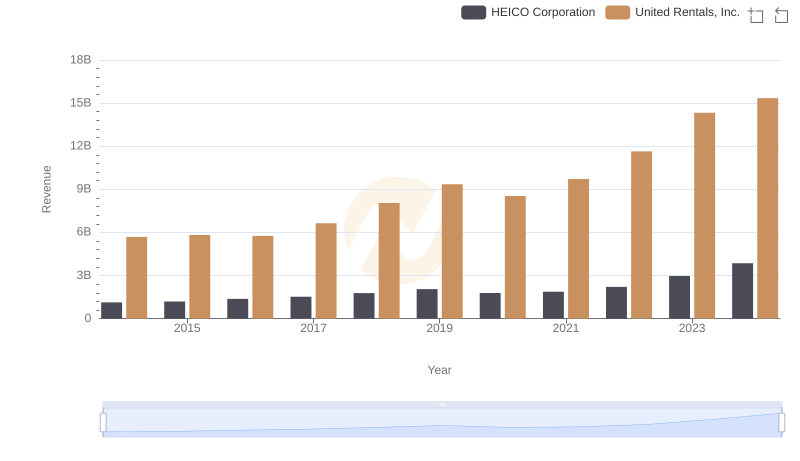
Who Generates More Revenue? United Rentals, Inc. or HEICO Corporation
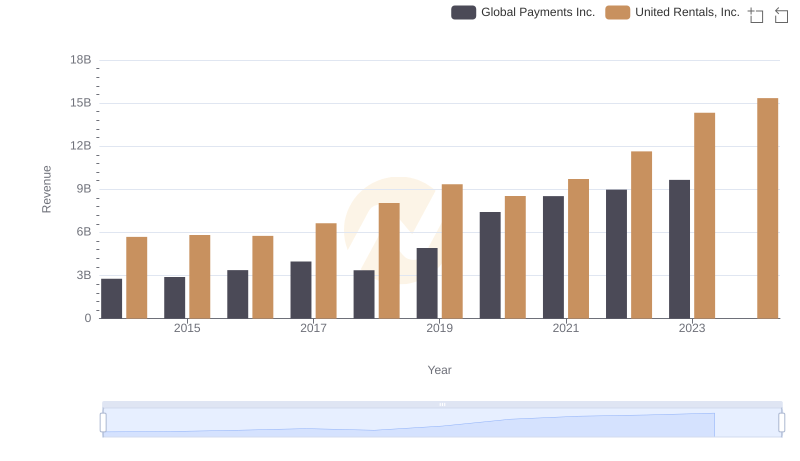
Comparing Revenue Performance: United Rentals, Inc. or Global Payments Inc.?
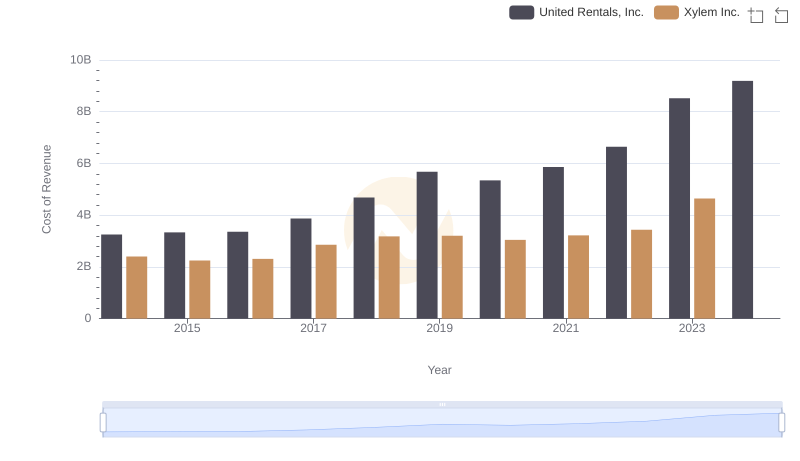
Cost of Revenue Comparison: United Rentals, Inc. vs Xylem Inc.
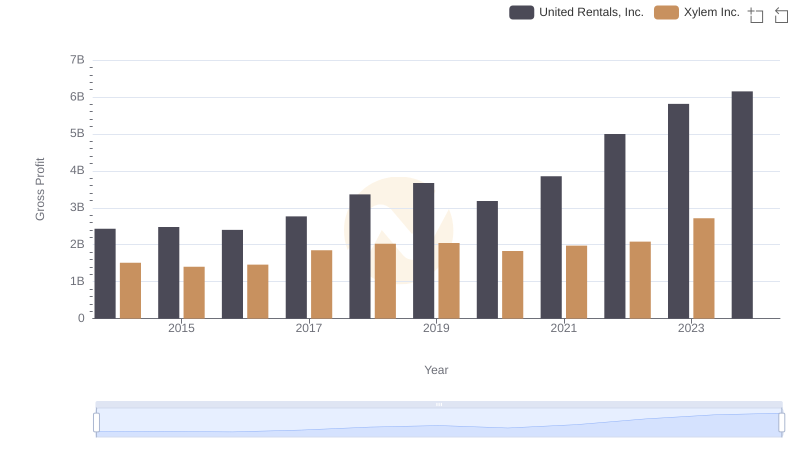
Gross Profit Comparison: United Rentals, Inc. and Xylem Inc. Trends
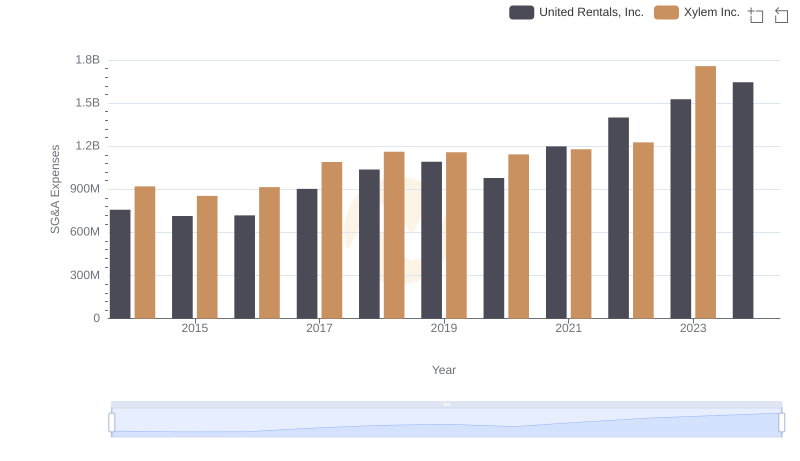
United Rentals, Inc. and Xylem Inc.: SG&A Spending Patterns Compared
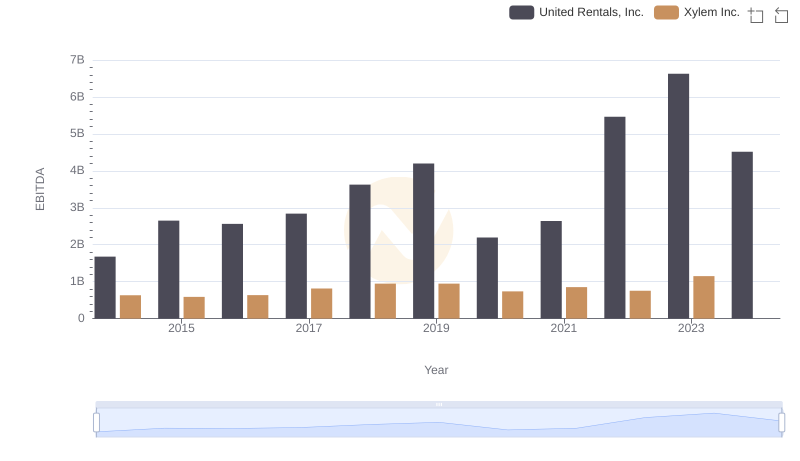
A Side-by-Side Analysis of EBITDA: United Rentals, Inc. and Xylem Inc.