| __timestamp | Curtiss-Wright Corporation | United Rentals, Inc. |
|---|---|---|
| Wednesday, January 1, 2014 | 1466610000 | 3253000000 |
| Thursday, January 1, 2015 | 1422428000 | 3337000000 |
| Friday, January 1, 2016 | 1358448000 | 3359000000 |
| Sunday, January 1, 2017 | 1452431000 | 3872000000 |
| Monday, January 1, 2018 | 1540574000 | 4683000000 |
| Tuesday, January 1, 2019 | 1589216000 | 5681000000 |
| Wednesday, January 1, 2020 | 1550109000 | 5347000000 |
| Friday, January 1, 2021 | 1572575000 | 5863000000 |
| Saturday, January 1, 2022 | 1602416000 | 6646000000 |
| Sunday, January 1, 2023 | 1778195000 | 8519000000 |
| Monday, January 1, 2024 | 1967640000 | 9195000000 |
Unleashing the power of data
In the competitive landscape of industrial services, United Rentals, Inc. and Curtiss-Wright Corporation have showcased distinct trajectories in their cost of revenue from 2014 to 2023. United Rentals, Inc. has seen a robust growth, with its cost of revenue surging by approximately 162% over the decade, peaking at an impressive $8.5 billion in 2023. This reflects the company's aggressive expansion and strategic acquisitions. In contrast, Curtiss-Wright Corporation has maintained a more stable cost structure, with a modest increase of around 21% over the same period, reaching $1.78 billion in 2023. This stability underscores its focus on operational efficiency and steady growth. Notably, data for Curtiss-Wright in 2024 is missing, leaving room for speculation on its future trajectory. As these industry leaders continue to evolve, their cost management strategies will be pivotal in shaping their competitive edge.
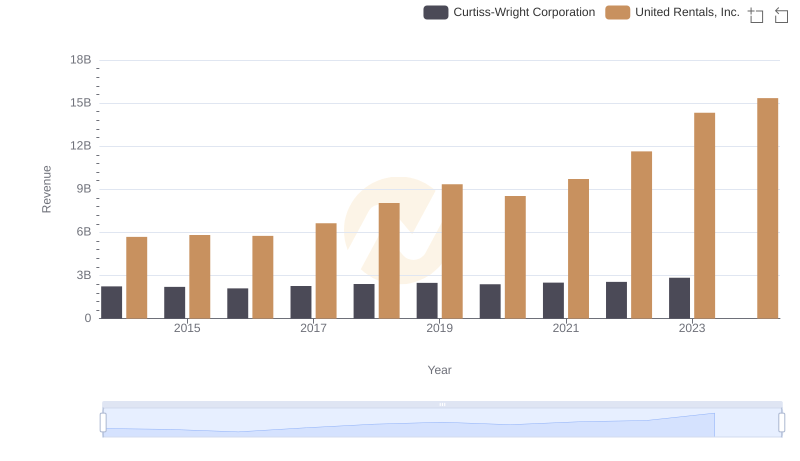
Who Generates More Revenue? United Rentals, Inc. or Curtiss-Wright Corporation
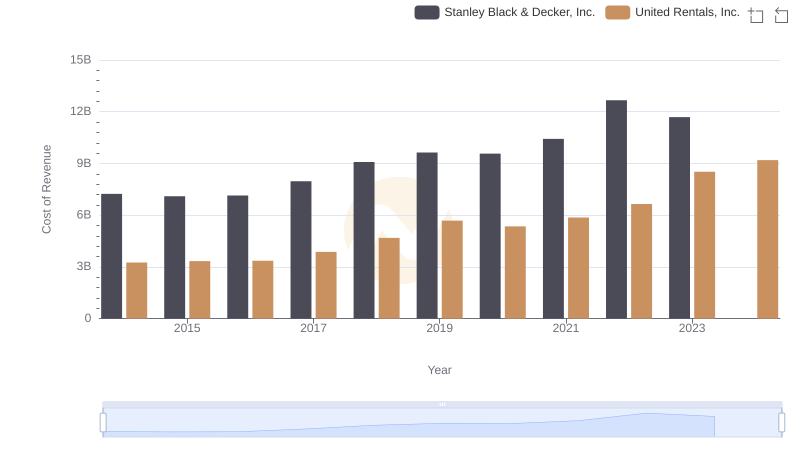
Comparing Cost of Revenue Efficiency: United Rentals, Inc. vs Stanley Black & Decker, Inc.
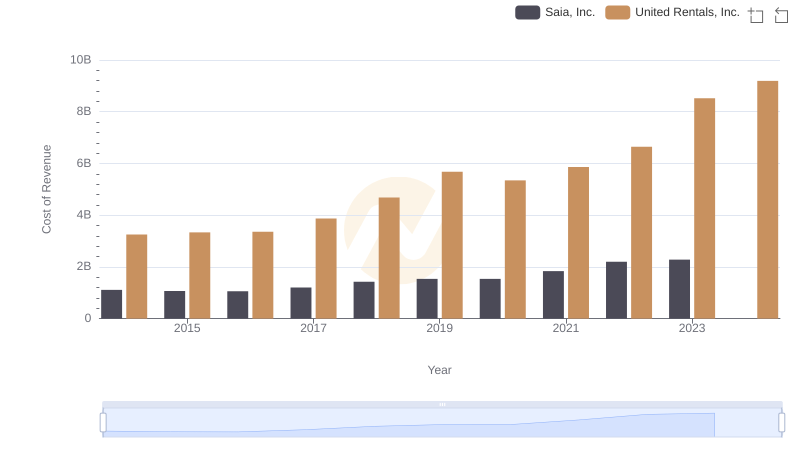
Cost of Revenue Comparison: United Rentals, Inc. vs Saia, Inc.
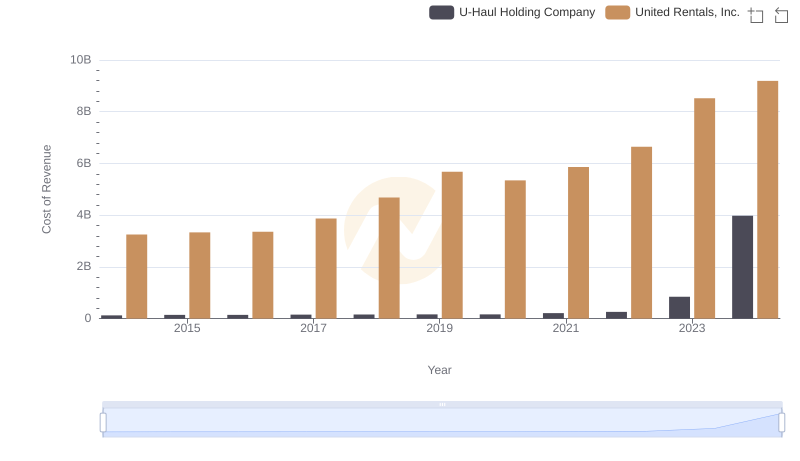
Cost of Revenue Comparison: United Rentals, Inc. vs U-Haul Holding Company
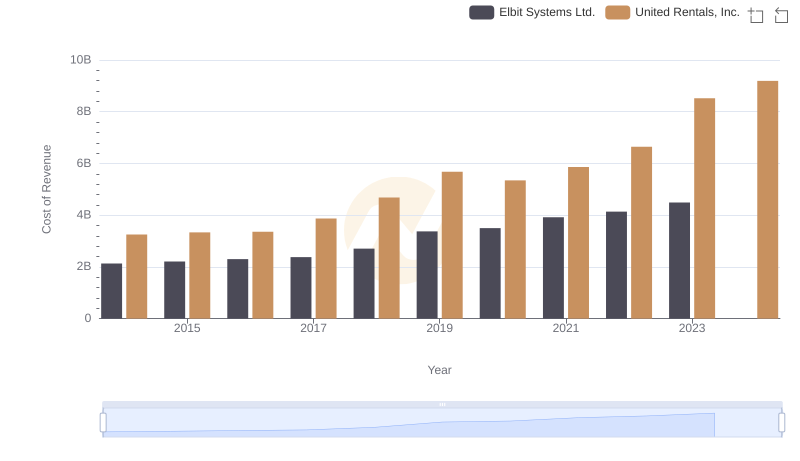
Comparing Cost of Revenue Efficiency: United Rentals, Inc. vs Elbit Systems Ltd.
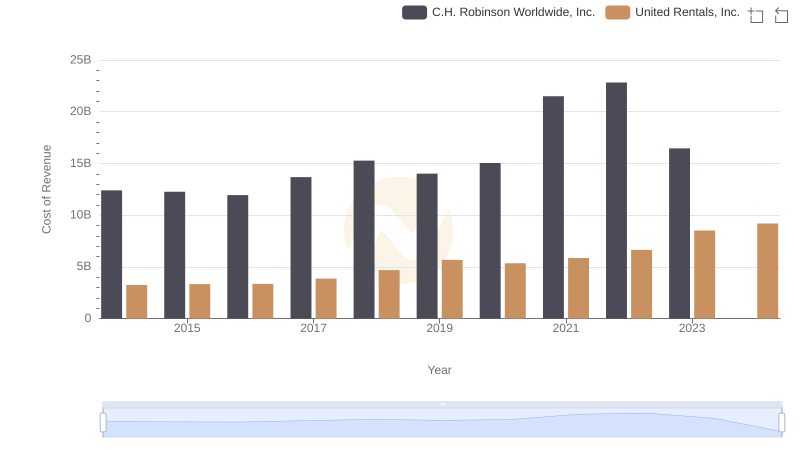
United Rentals, Inc. vs C.H. Robinson Worldwide, Inc.: Efficiency in Cost of Revenue Explored
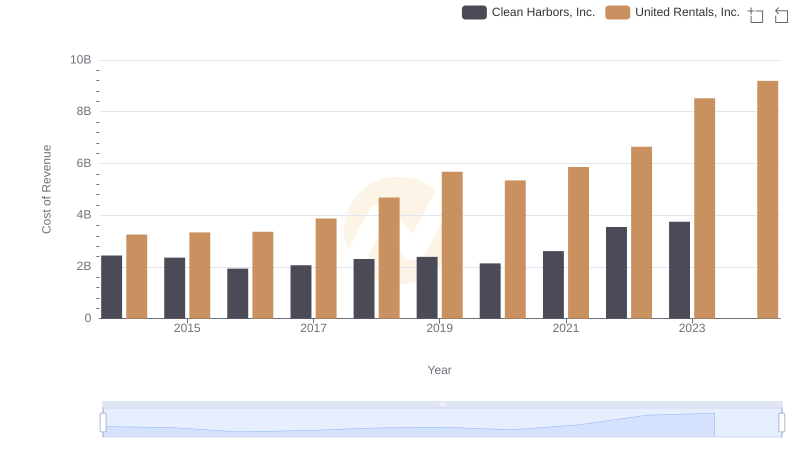
Cost of Revenue: Key Insights for United Rentals, Inc. and Clean Harbors, Inc.
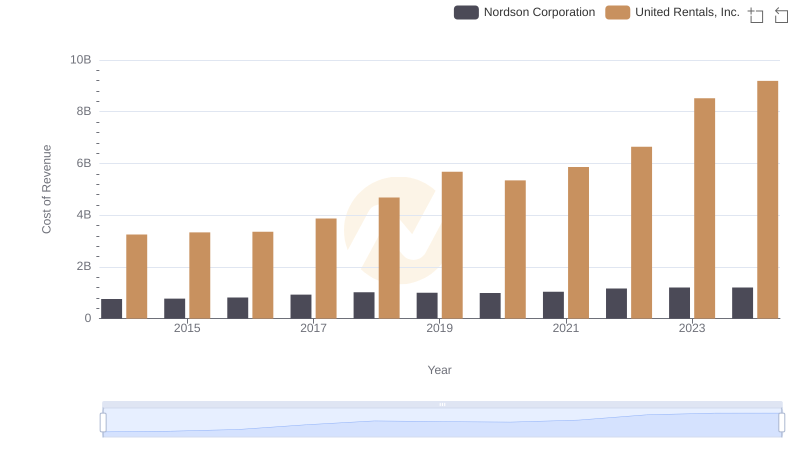
Comparing Cost of Revenue Efficiency: United Rentals, Inc. vs Nordson Corporation
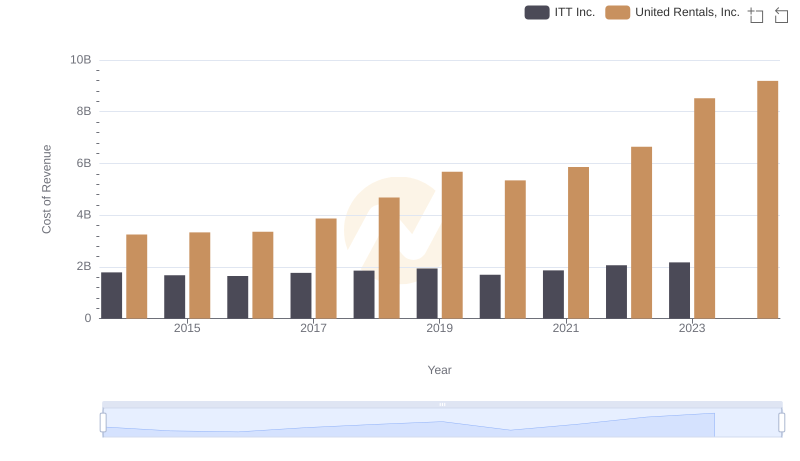
Cost of Revenue Comparison: United Rentals, Inc. vs ITT Inc.

United Rentals, Inc. and Curtiss-Wright Corporation: A Detailed Gross Profit Analysis

Comparing SG&A Expenses: United Rentals, Inc. vs Curtiss-Wright Corporation Trends and Insights
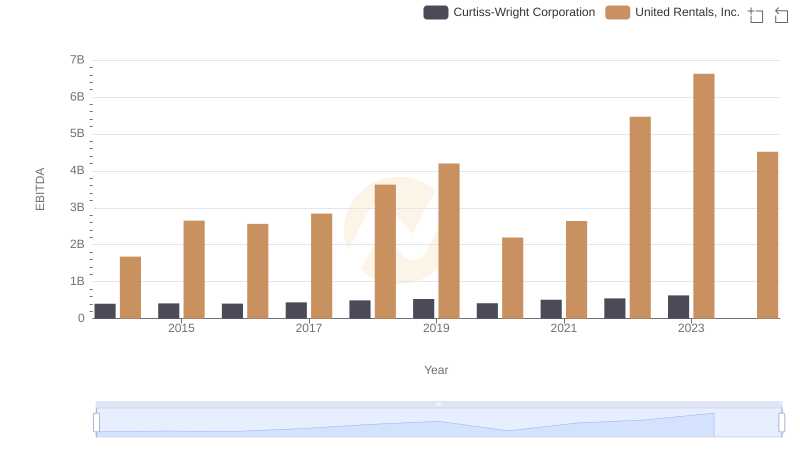
Comparative EBITDA Analysis: United Rentals, Inc. vs Curtiss-Wright Corporation