| __timestamp | Saia, Inc. | United Rentals, Inc. |
|---|---|---|
| Wednesday, January 1, 2014 | 159268000 | 2432000000 |
| Thursday, January 1, 2015 | 154120000 | 2480000000 |
| Friday, January 1, 2016 | 159502000 | 2403000000 |
| Sunday, January 1, 2017 | 175046000 | 2769000000 |
| Monday, January 1, 2018 | 230070000 | 3364000000 |
| Tuesday, January 1, 2019 | 249653000 | 3670000000 |
| Wednesday, January 1, 2020 | 283848000 | 3183000000 |
| Friday, January 1, 2021 | 451687000 | 3853000000 |
| Saturday, January 1, 2022 | 590963000 | 4996000000 |
| Sunday, January 1, 2023 | 598932000 | 5813000000 |
| Monday, January 1, 2024 | 6150000000 |
Unleashing the power of data
In the ever-evolving landscape of the U.S. stock market, the financial trajectories of United Rentals, Inc. and Saia, Inc. offer a compelling narrative of growth and resilience. Over the past decade, United Rentals has consistently outperformed Saia, with its gross profit soaring by approximately 140% from 2014 to 2023. This remarkable growth underscores its dominant position in the equipment rental industry. Meanwhile, Saia, Inc., a key player in the transportation sector, has demonstrated impressive growth, with its gross profit increasing by nearly 275% over the same period. This surge highlights Saia's strategic expansion and operational efficiency. However, the data for 2024 remains incomplete, leaving room for speculation and anticipation. As these two industry leaders continue to navigate economic challenges, their financial performance will be closely watched by investors and analysts alike.

Breaking Down Revenue Trends: United Rentals, Inc. vs Saia, Inc.
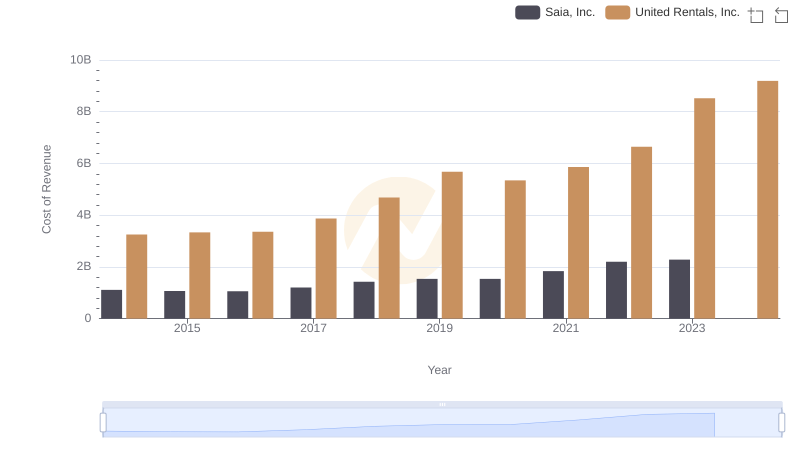
Cost of Revenue Comparison: United Rentals, Inc. vs Saia, Inc.
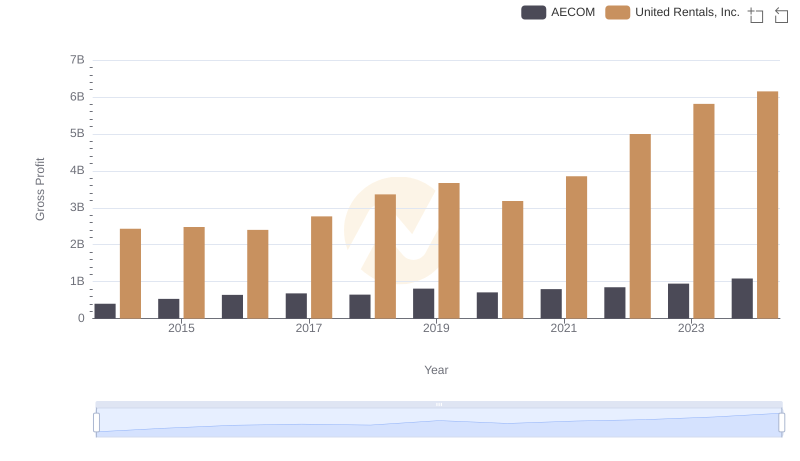
United Rentals, Inc. and AECOM: A Detailed Gross Profit Analysis

United Rentals, Inc. and Stanley Black & Decker, Inc.: A Detailed Gross Profit Analysis
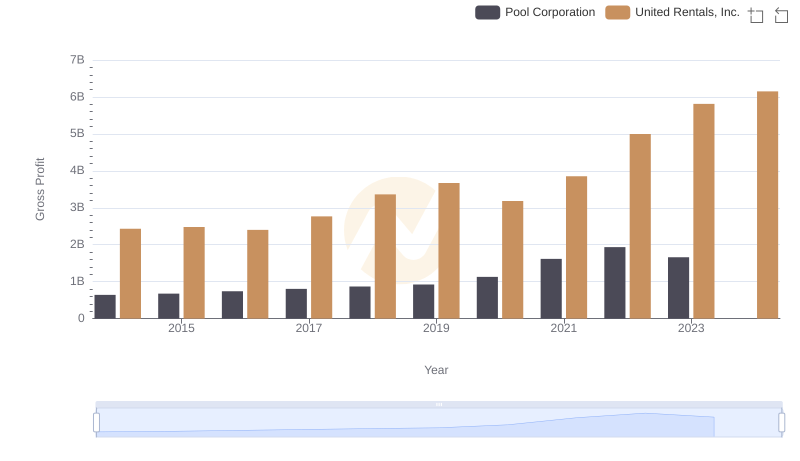
United Rentals, Inc. vs Pool Corporation: A Gross Profit Performance Breakdown

Gross Profit Comparison: United Rentals, Inc. and U-Haul Holding Company Trends
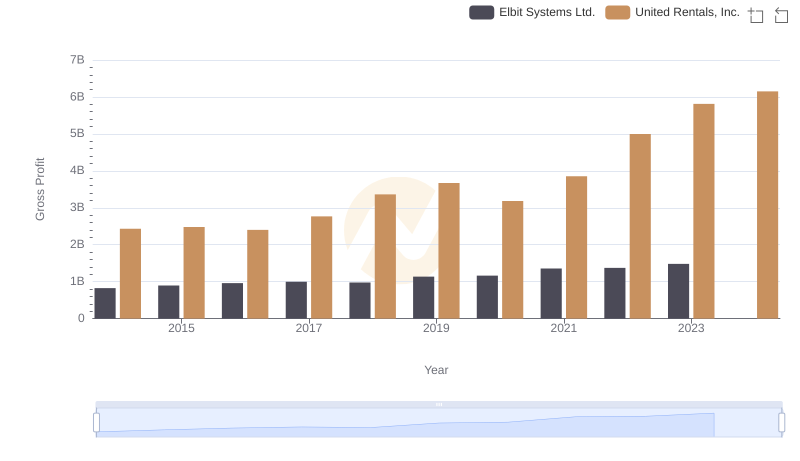
Gross Profit Analysis: Comparing United Rentals, Inc. and Elbit Systems Ltd.

Gross Profit Trends Compared: United Rentals, Inc. vs C.H. Robinson Worldwide, Inc.
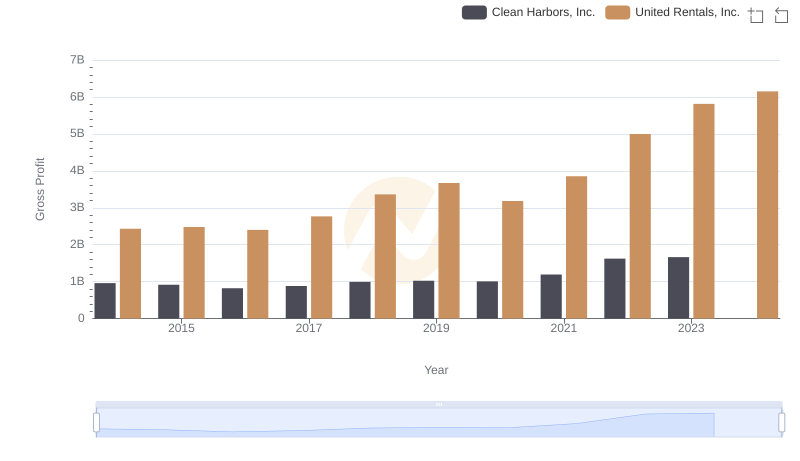
United Rentals, Inc. and Clean Harbors, Inc.: A Detailed Gross Profit Analysis

United Rentals, Inc. and Curtiss-Wright Corporation: A Detailed Gross Profit Analysis
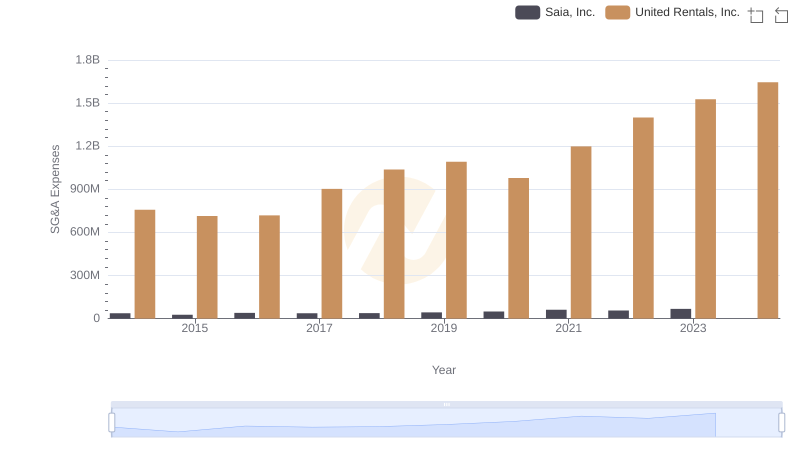
Breaking Down SG&A Expenses: United Rentals, Inc. vs Saia, Inc.
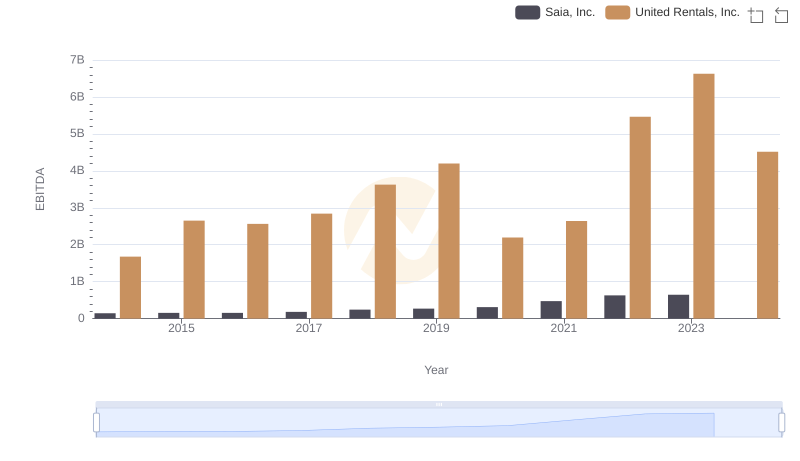
United Rentals, Inc. vs Saia, Inc.: In-Depth EBITDA Performance Comparison