| __timestamp | Nordson Corporation | United Rentals, Inc. |
|---|---|---|
| Wednesday, January 1, 2014 | 758923000 | 3253000000 |
| Thursday, January 1, 2015 | 774702000 | 3337000000 |
| Friday, January 1, 2016 | 815495000 | 3359000000 |
| Sunday, January 1, 2017 | 927981000 | 3872000000 |
| Monday, January 1, 2018 | 1018703000 | 4683000000 |
| Tuesday, January 1, 2019 | 1002123000 | 5681000000 |
| Wednesday, January 1, 2020 | 990632000 | 5347000000 |
| Friday, January 1, 2021 | 1038129000 | 5863000000 |
| Saturday, January 1, 2022 | 1163742000 | 6646000000 |
| Sunday, January 1, 2023 | 1203227000 | 8519000000 |
| Monday, January 1, 2024 | 1203792000 | 9195000000 |
Cracking the code
In the competitive landscape of industrial services and manufacturing, United Rentals, Inc. and Nordson Corporation stand as titans. Over the past decade, from 2014 to 2024, these companies have showcased distinct trajectories in cost of revenue efficiency. United Rentals, Inc. has seen a staggering increase of approximately 183% in its cost of revenue, rising from $3.25 billion in 2014 to an impressive $9.19 billion in 2024. This growth reflects its aggressive expansion and market dominance in equipment rental services. In contrast, Nordson Corporation, a leader in precision technology, has maintained a more stable growth, with its cost of revenue increasing by about 59% over the same period. This steady rise, from $759 million to $1.2 billion, underscores its strategic focus on innovation and efficiency. As these companies continue to evolve, their financial strategies offer valuable insights into managing costs in dynamic industries.
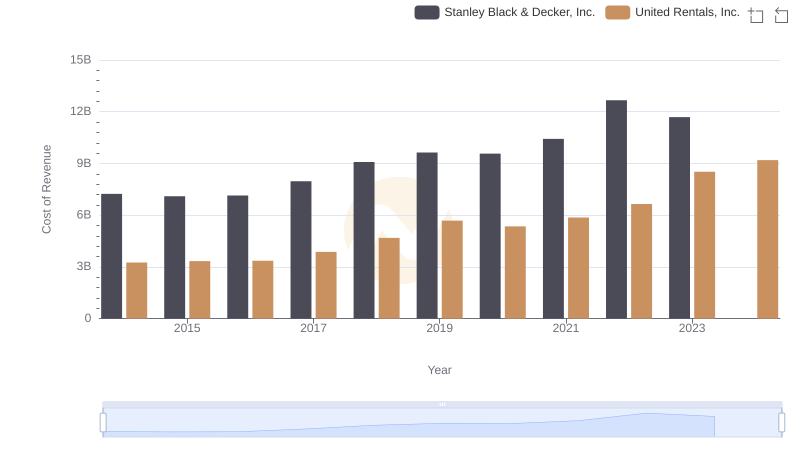
Comparing Cost of Revenue Efficiency: United Rentals, Inc. vs Stanley Black & Decker, Inc.
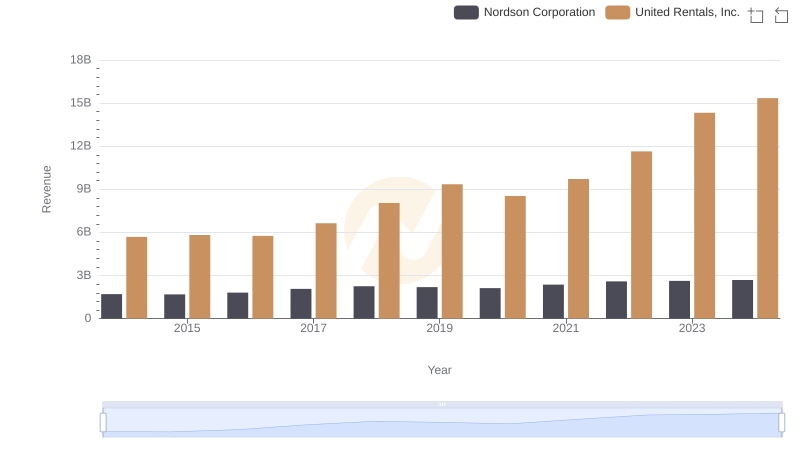
Revenue Showdown: United Rentals, Inc. vs Nordson Corporation
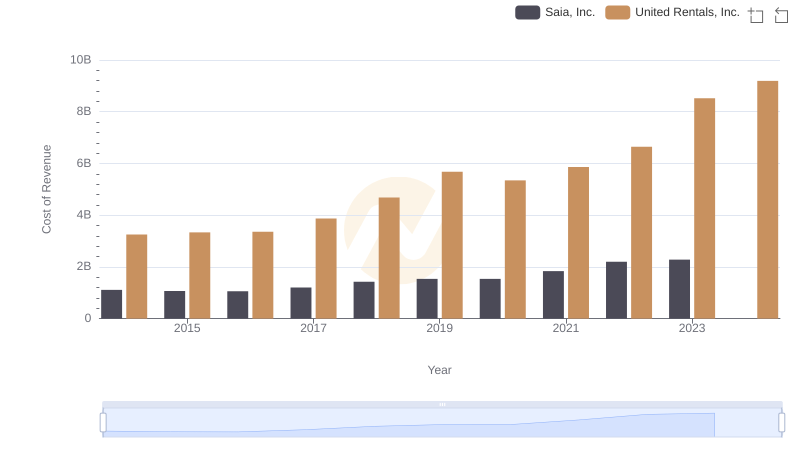
Cost of Revenue Comparison: United Rentals, Inc. vs Saia, Inc.
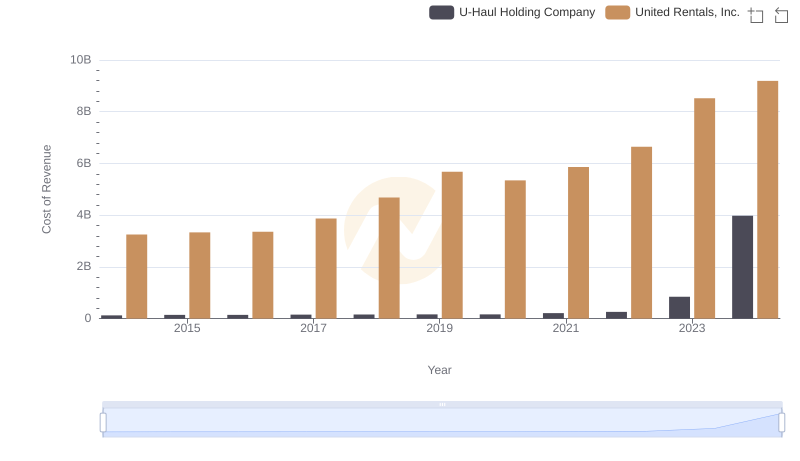
Cost of Revenue Comparison: United Rentals, Inc. vs U-Haul Holding Company
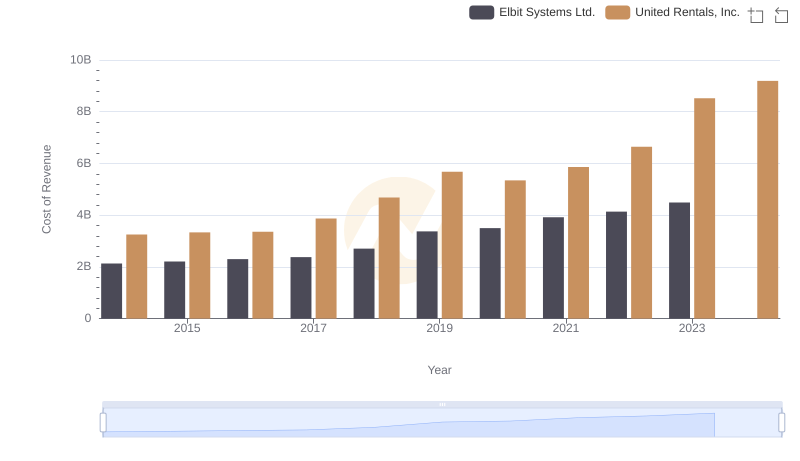
Comparing Cost of Revenue Efficiency: United Rentals, Inc. vs Elbit Systems Ltd.
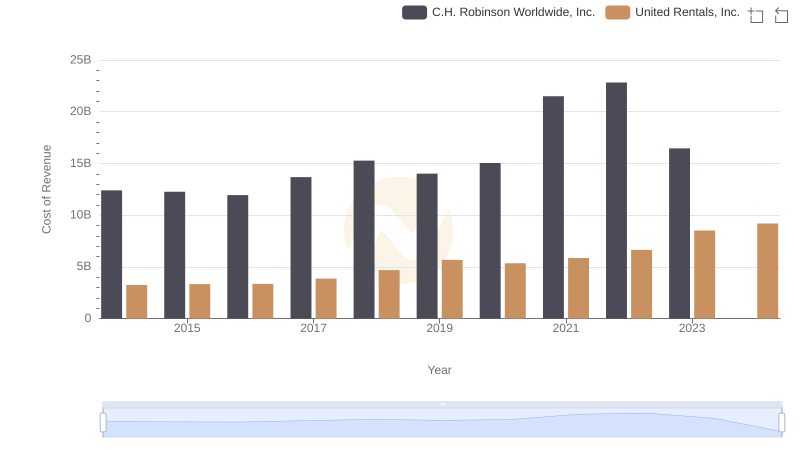
United Rentals, Inc. vs C.H. Robinson Worldwide, Inc.: Efficiency in Cost of Revenue Explored
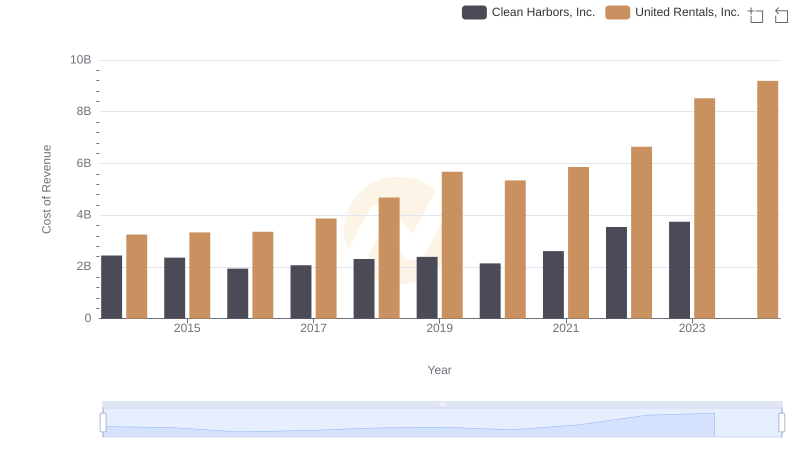
Cost of Revenue: Key Insights for United Rentals, Inc. and Clean Harbors, Inc.
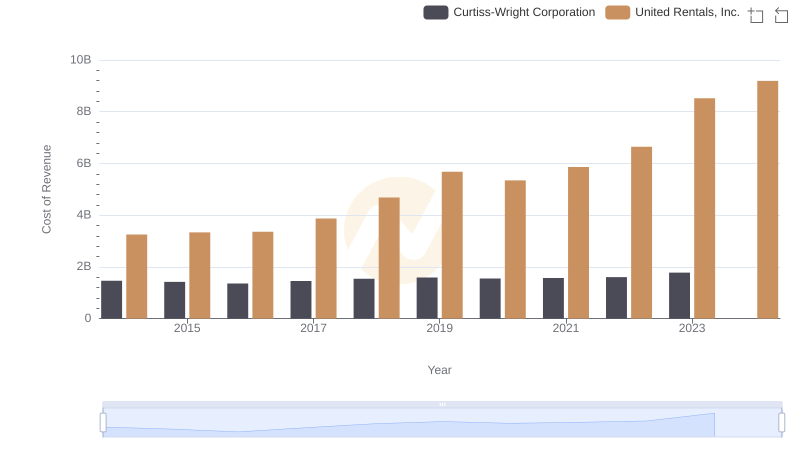
Cost of Revenue Trends: United Rentals, Inc. vs Curtiss-Wright Corporation
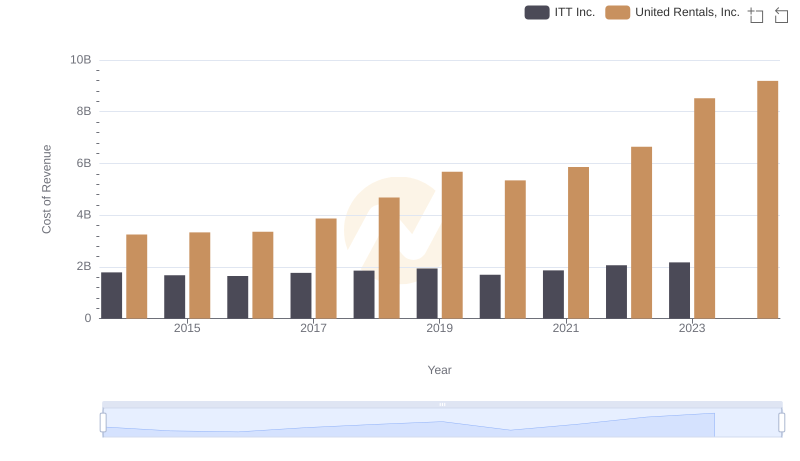
Cost of Revenue Comparison: United Rentals, Inc. vs ITT Inc.
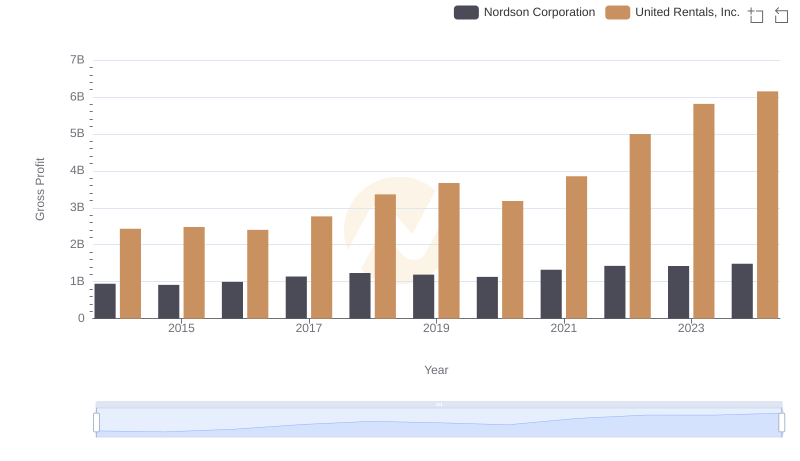
United Rentals, Inc. and Nordson Corporation: A Detailed Gross Profit Analysis
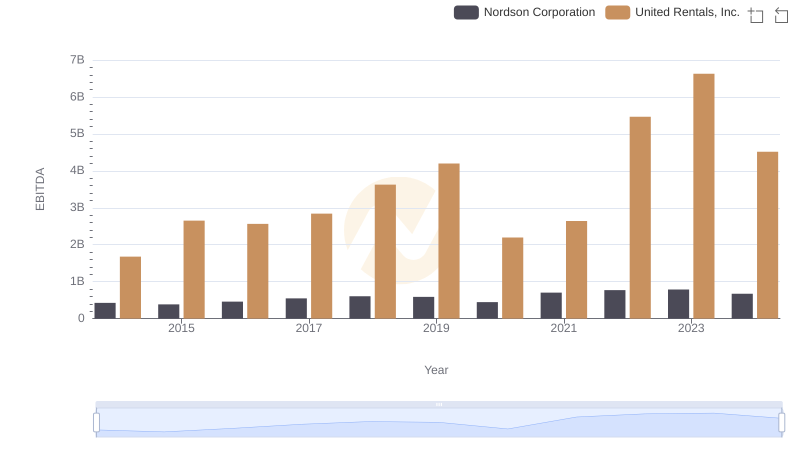
Comprehensive EBITDA Comparison: United Rentals, Inc. vs Nordson Corporation